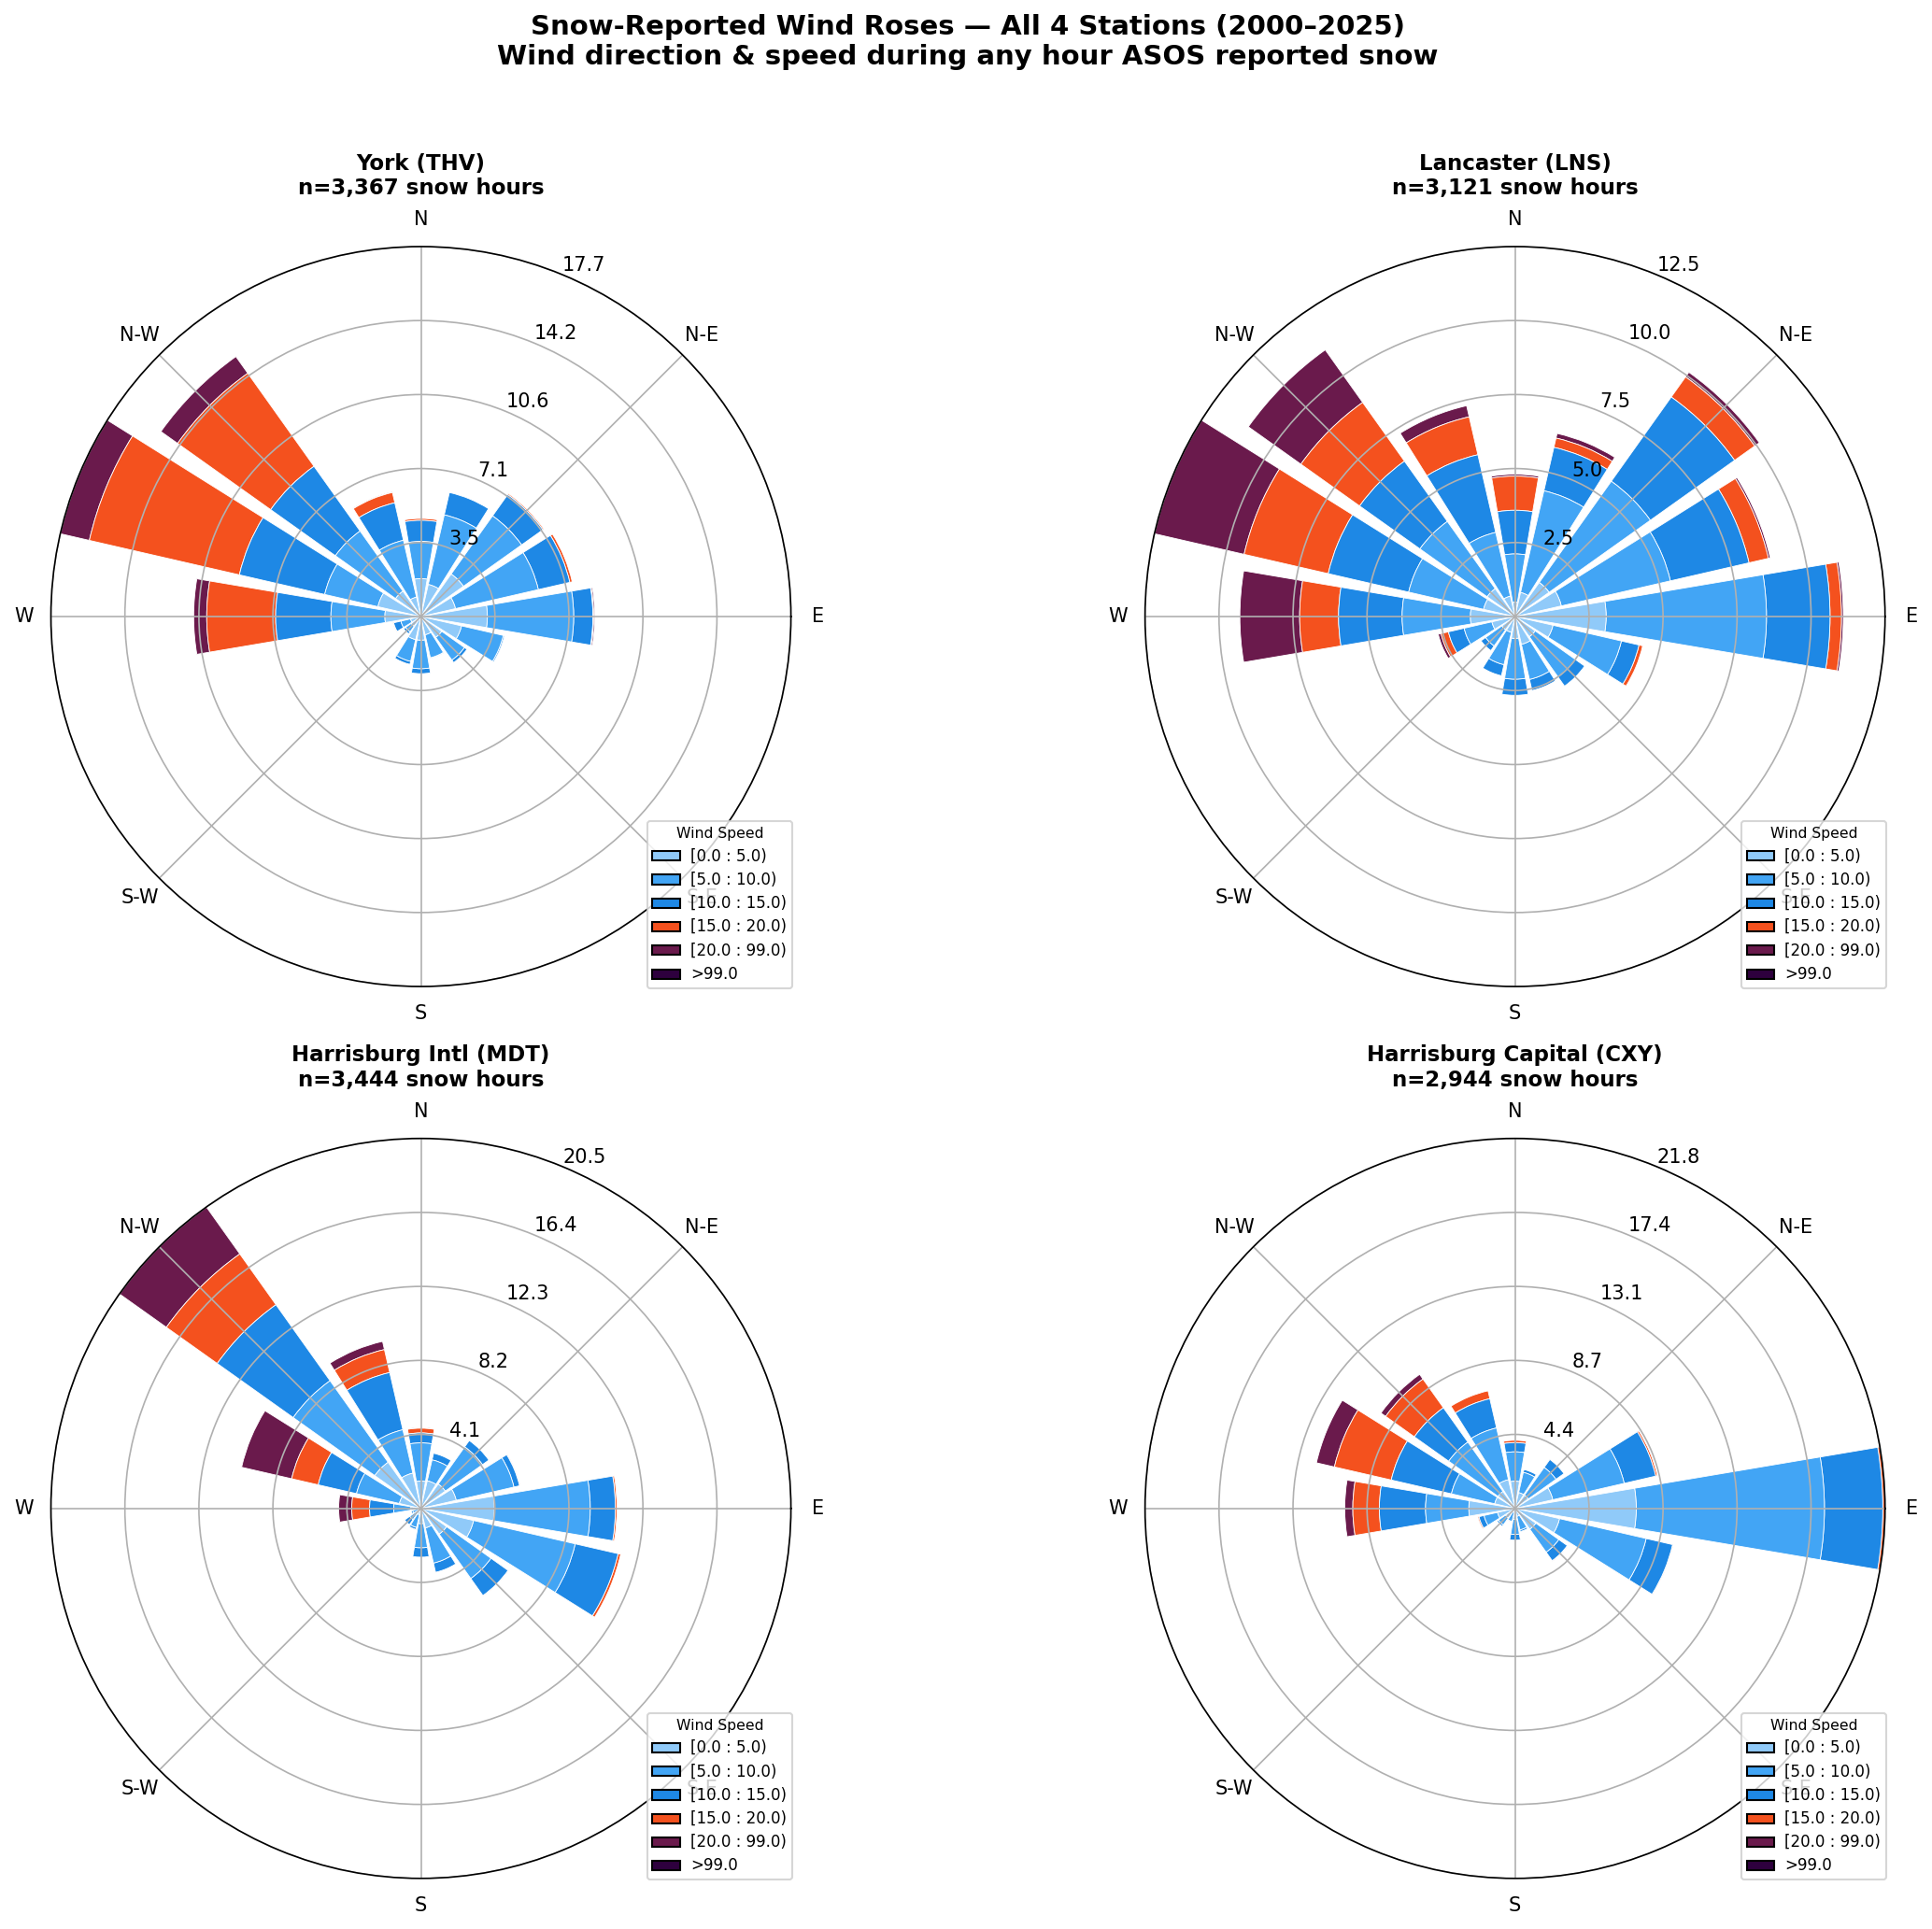
🌹 Overview — All 4 Stations During Snow Hours
Each panel shows the wind direction frequency and speed distribution during all hours when snow was reported at that station. Color represents wind speed band. Outer rings = more frequent. Note: dominant flow for all 4 stations comes from the west-northwest, consistent with continental air masses delivering cold, dry powder events. KMDT shows the most variable wind direction.
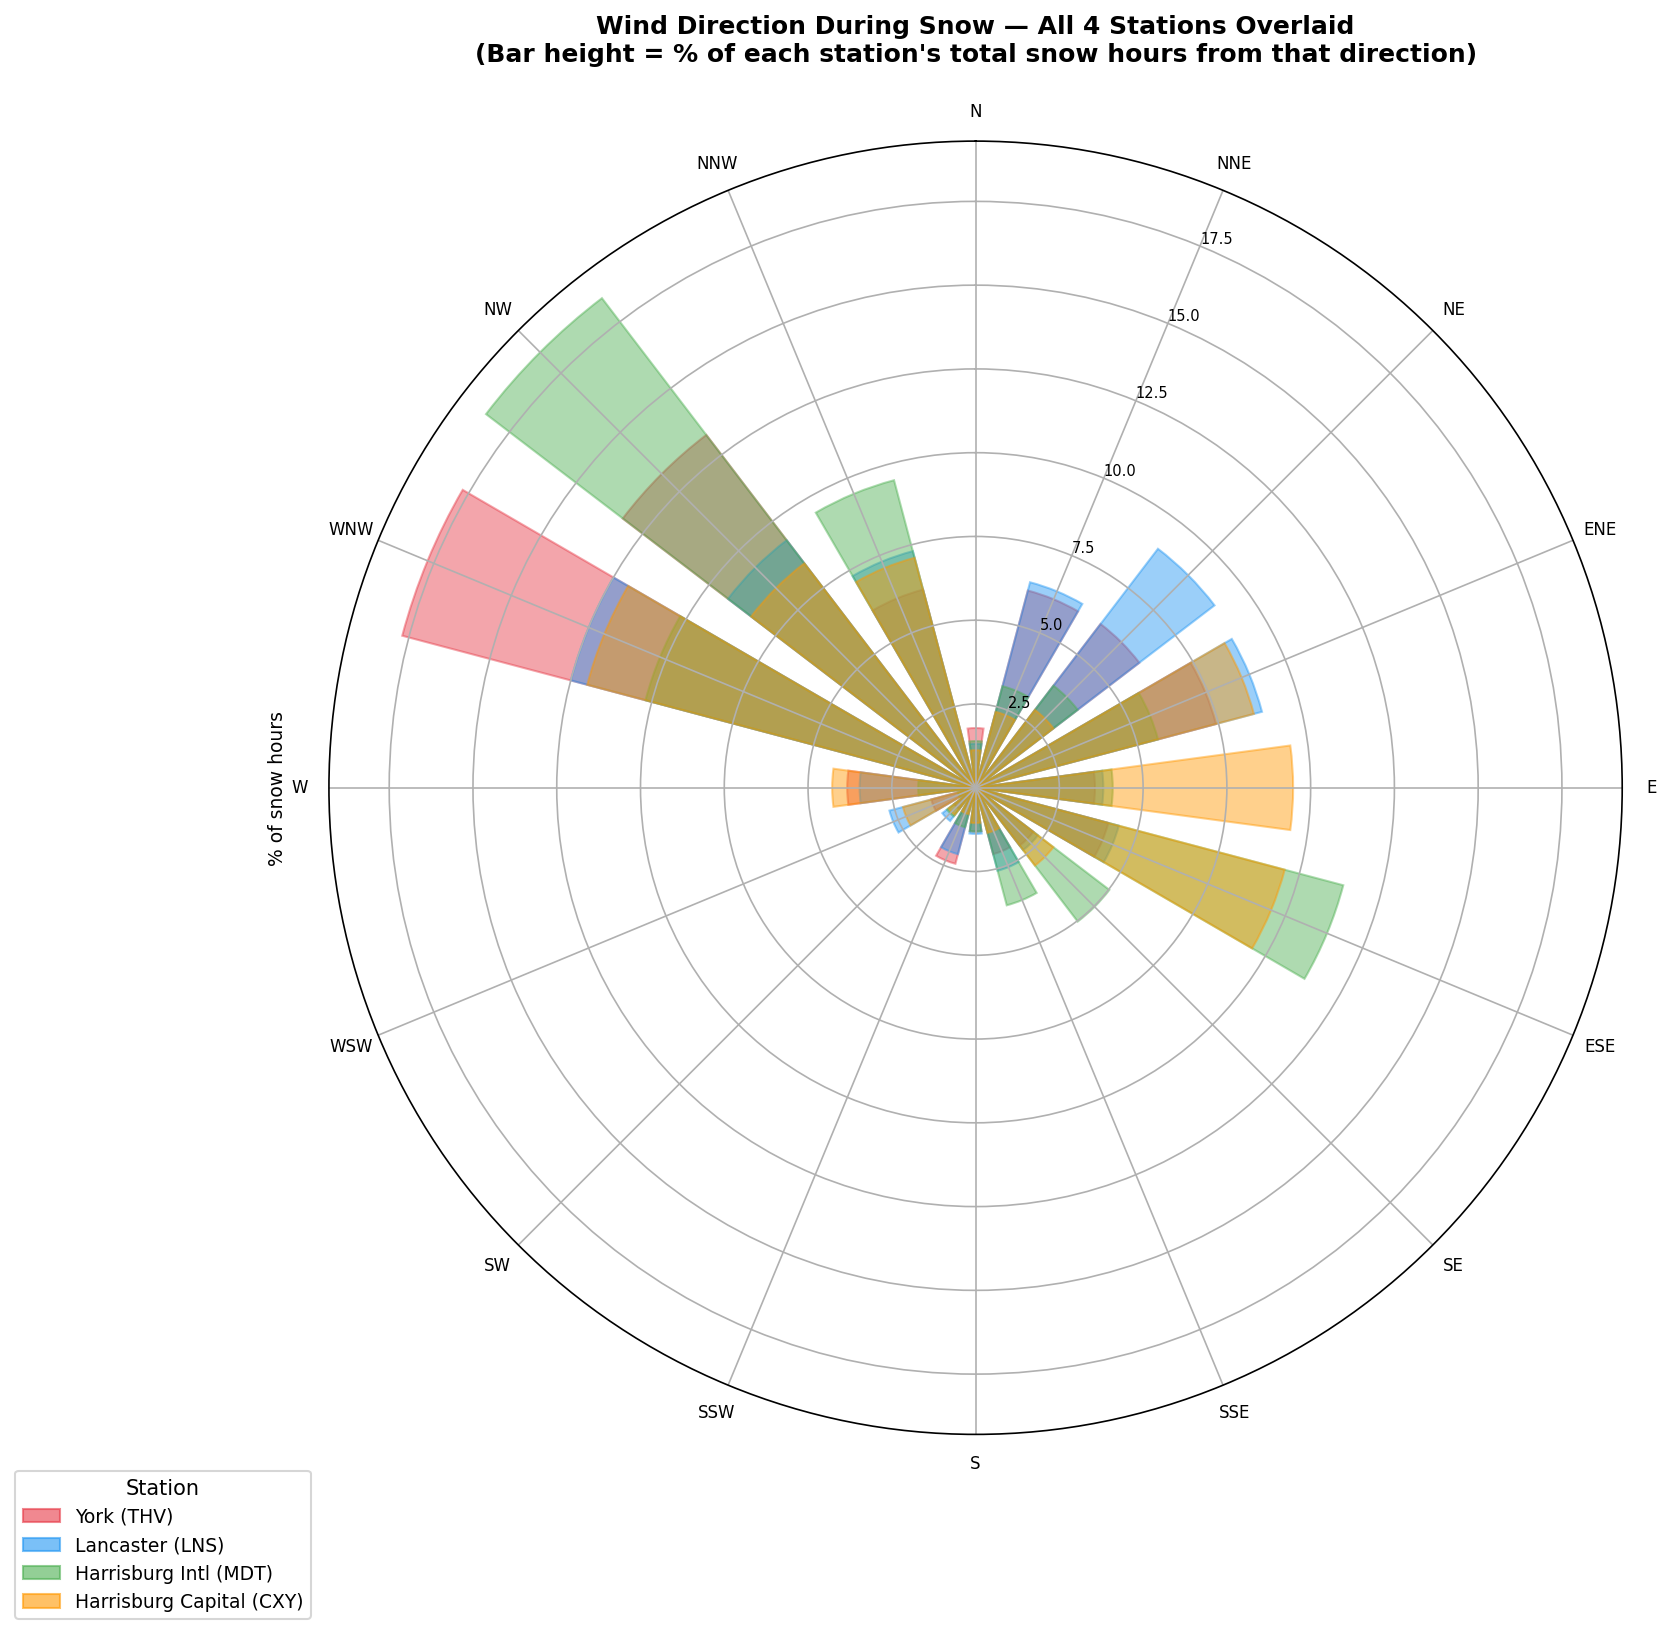
🎯 All 4 Stations Overlaid — Snow Wind Rose
Direct comparison of all four stations on a single polar plot. The directional signature is remarkably consistent across stations, confirming that regional-scale synoptic flow (rather than local terrain) dominates wind direction during snowfall at all four airports.
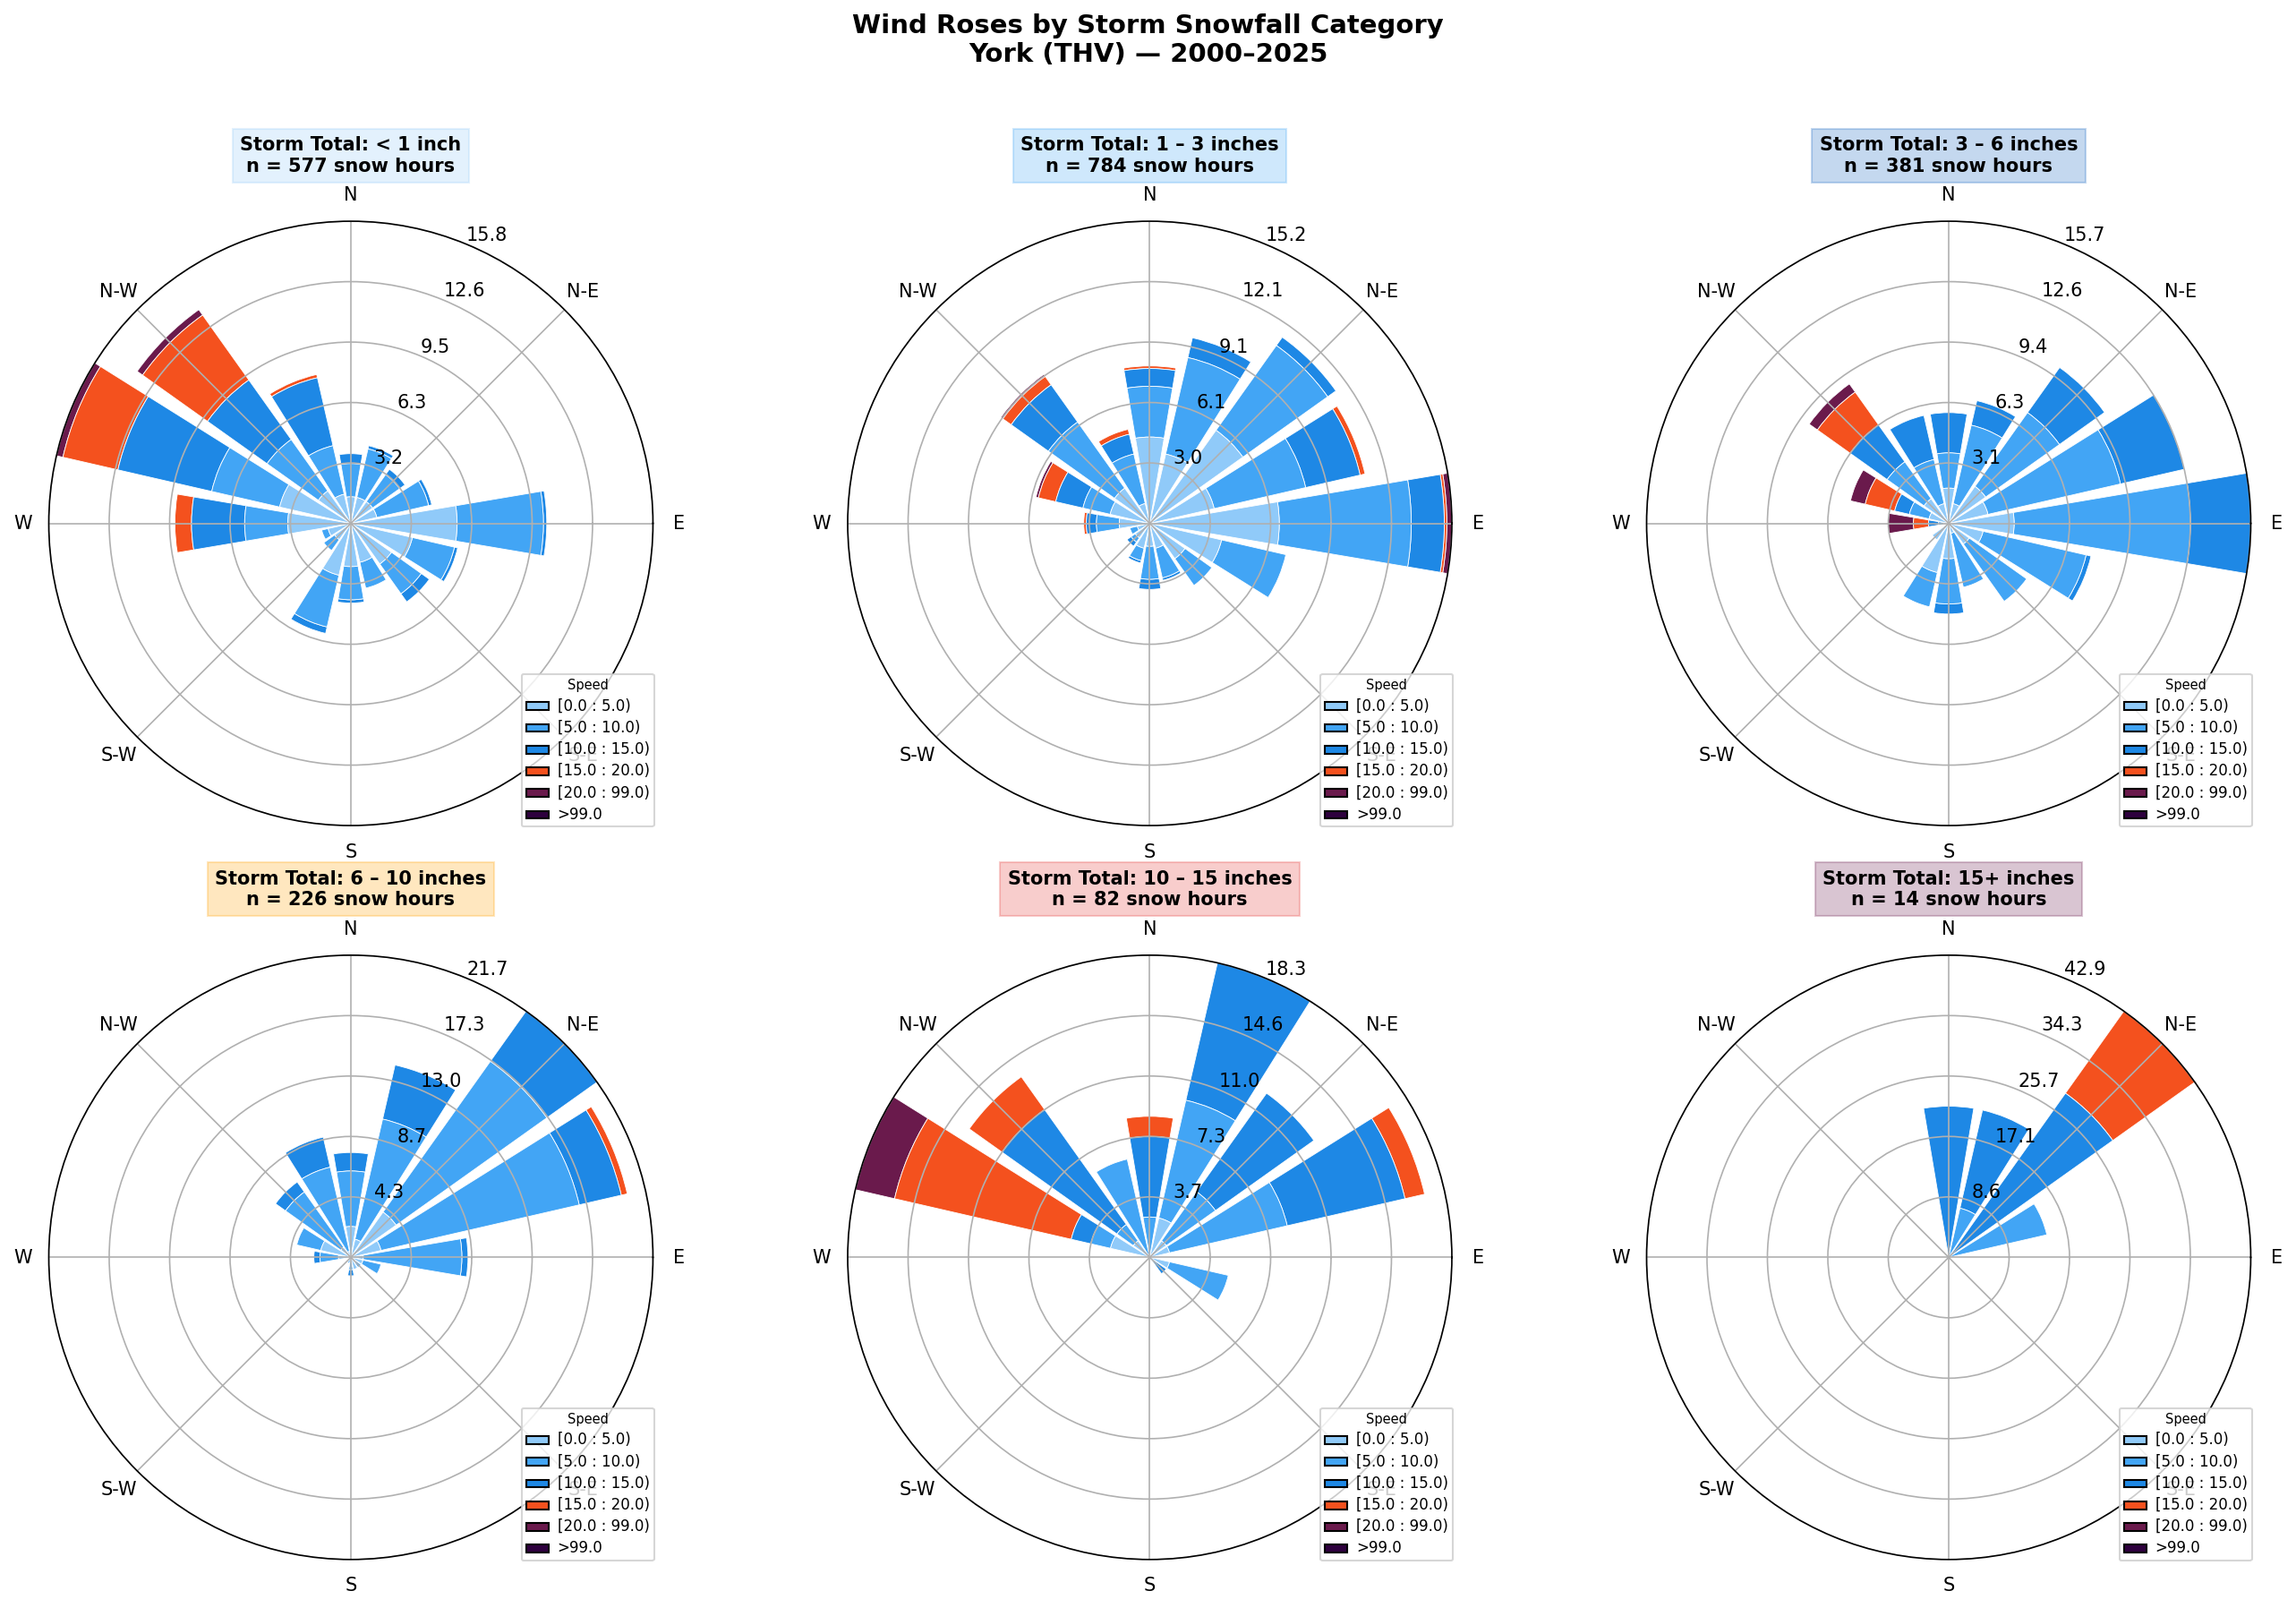
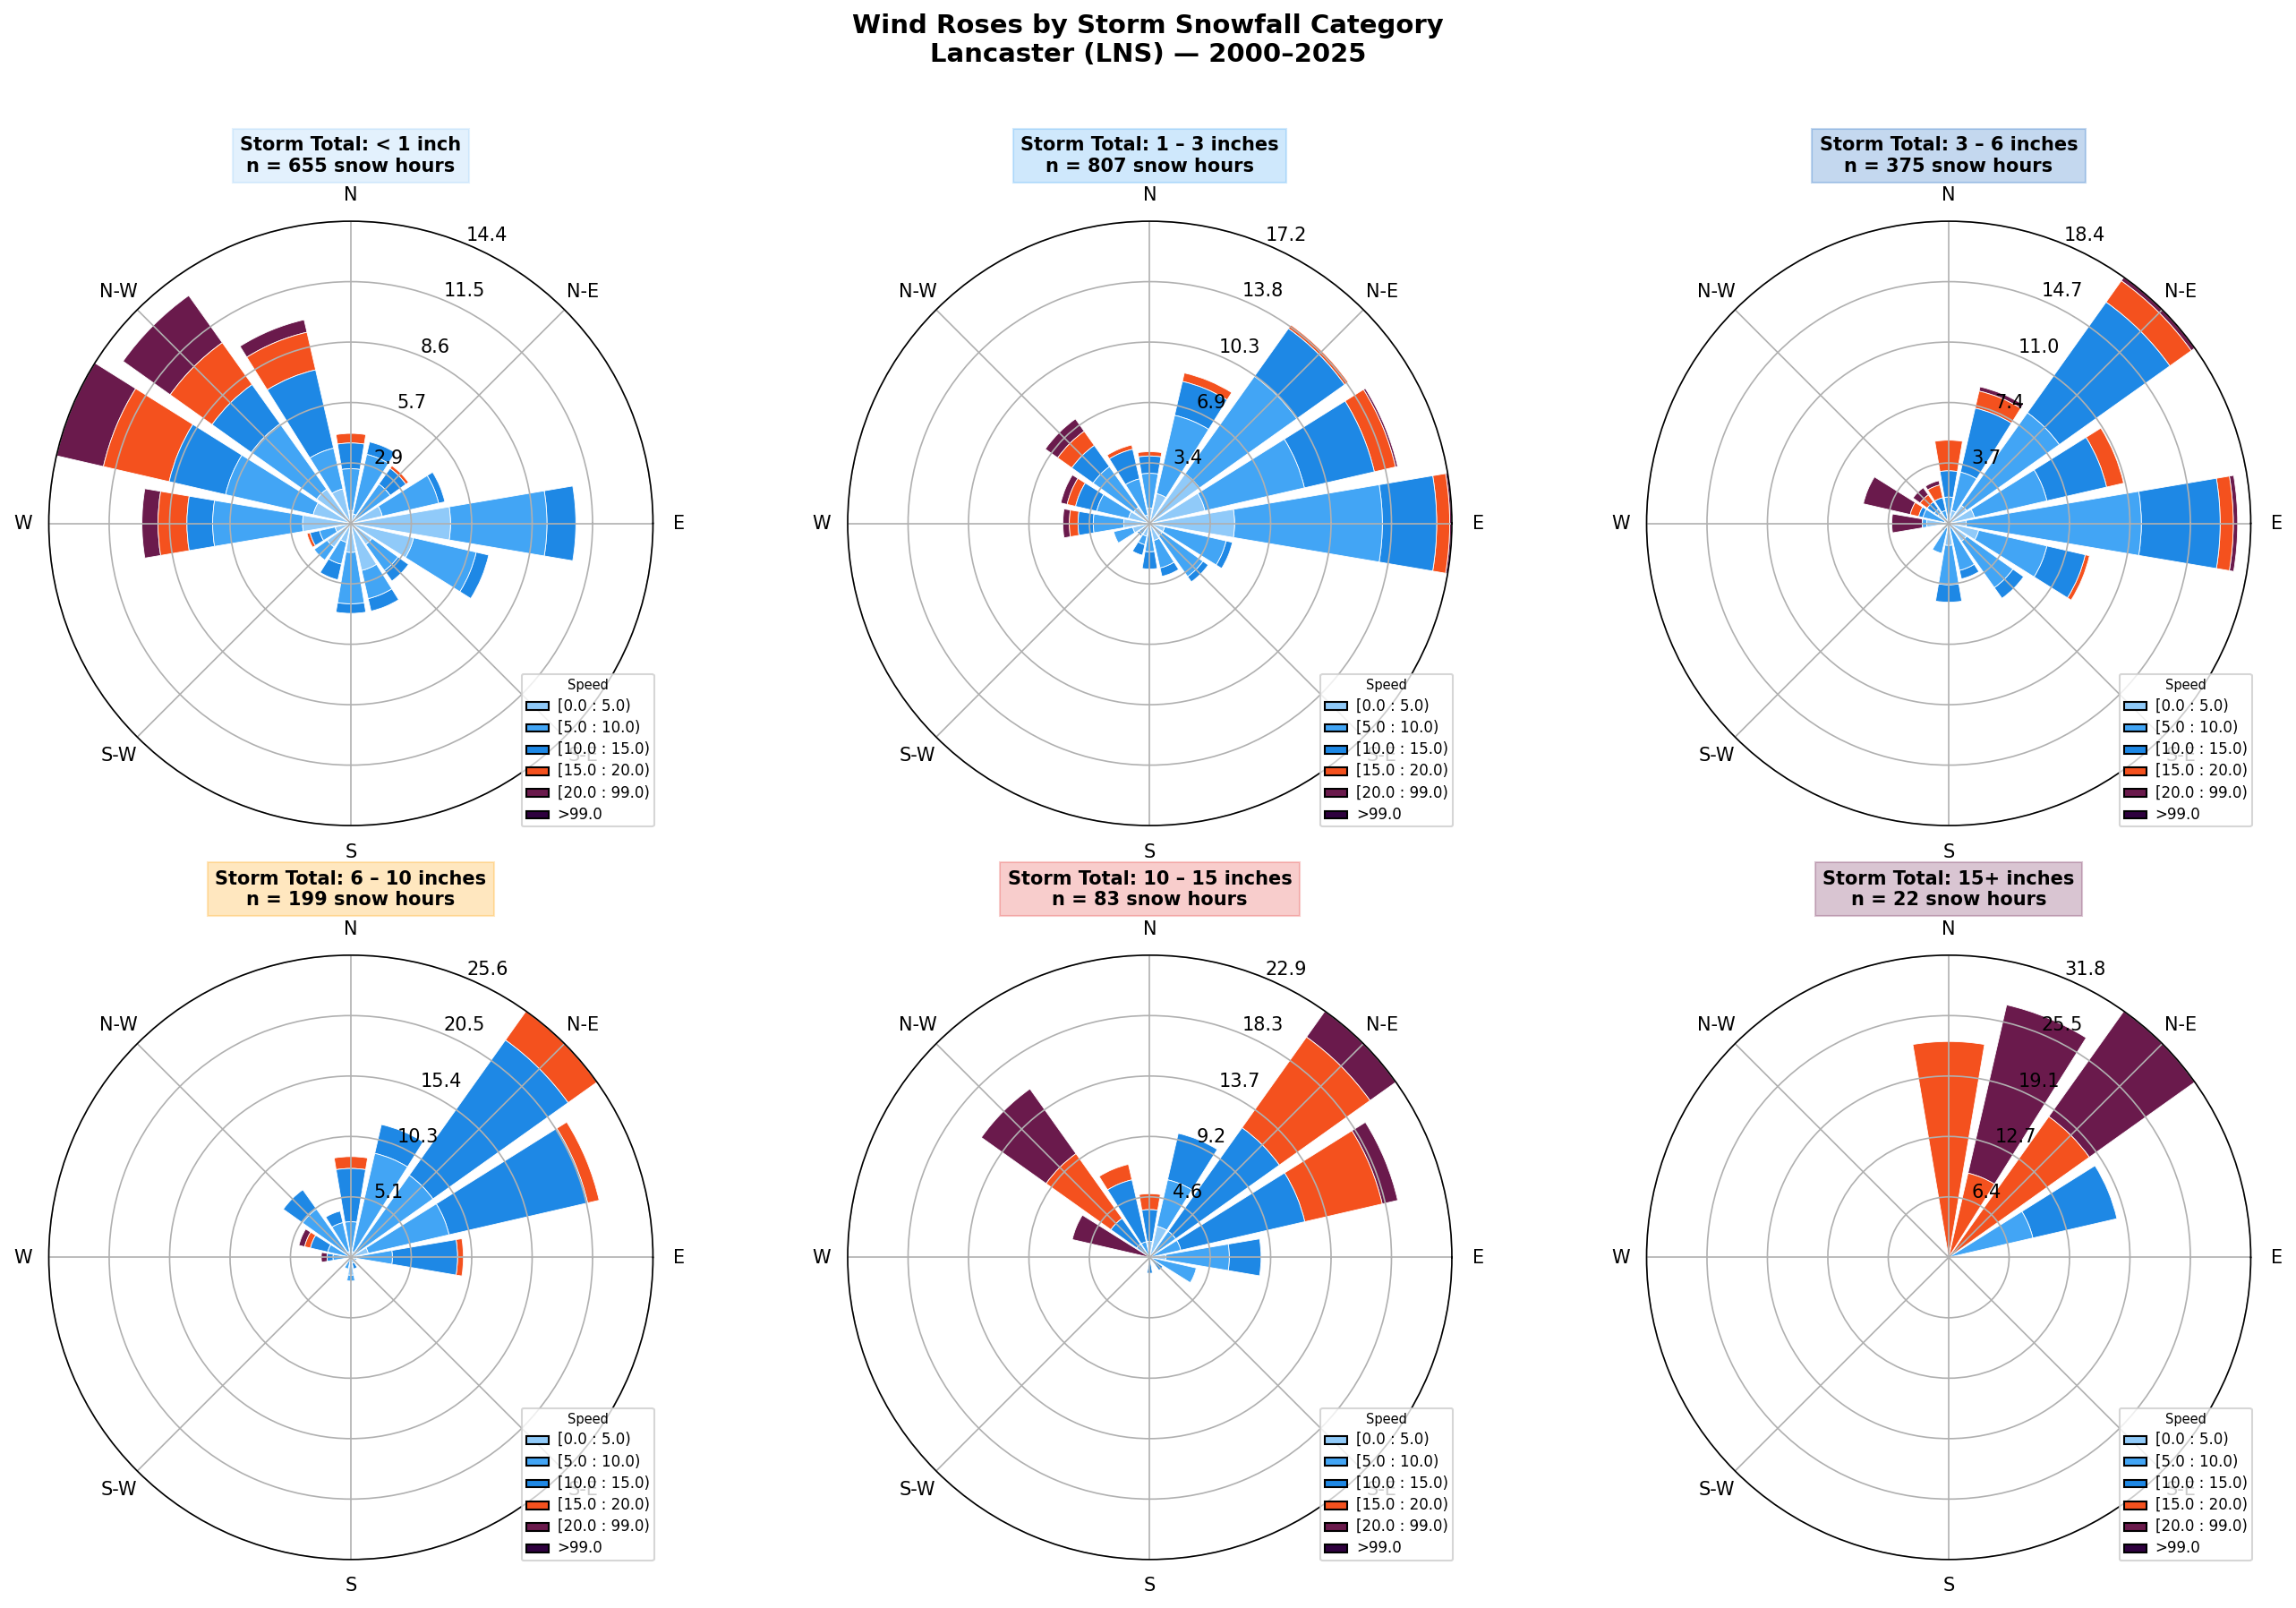
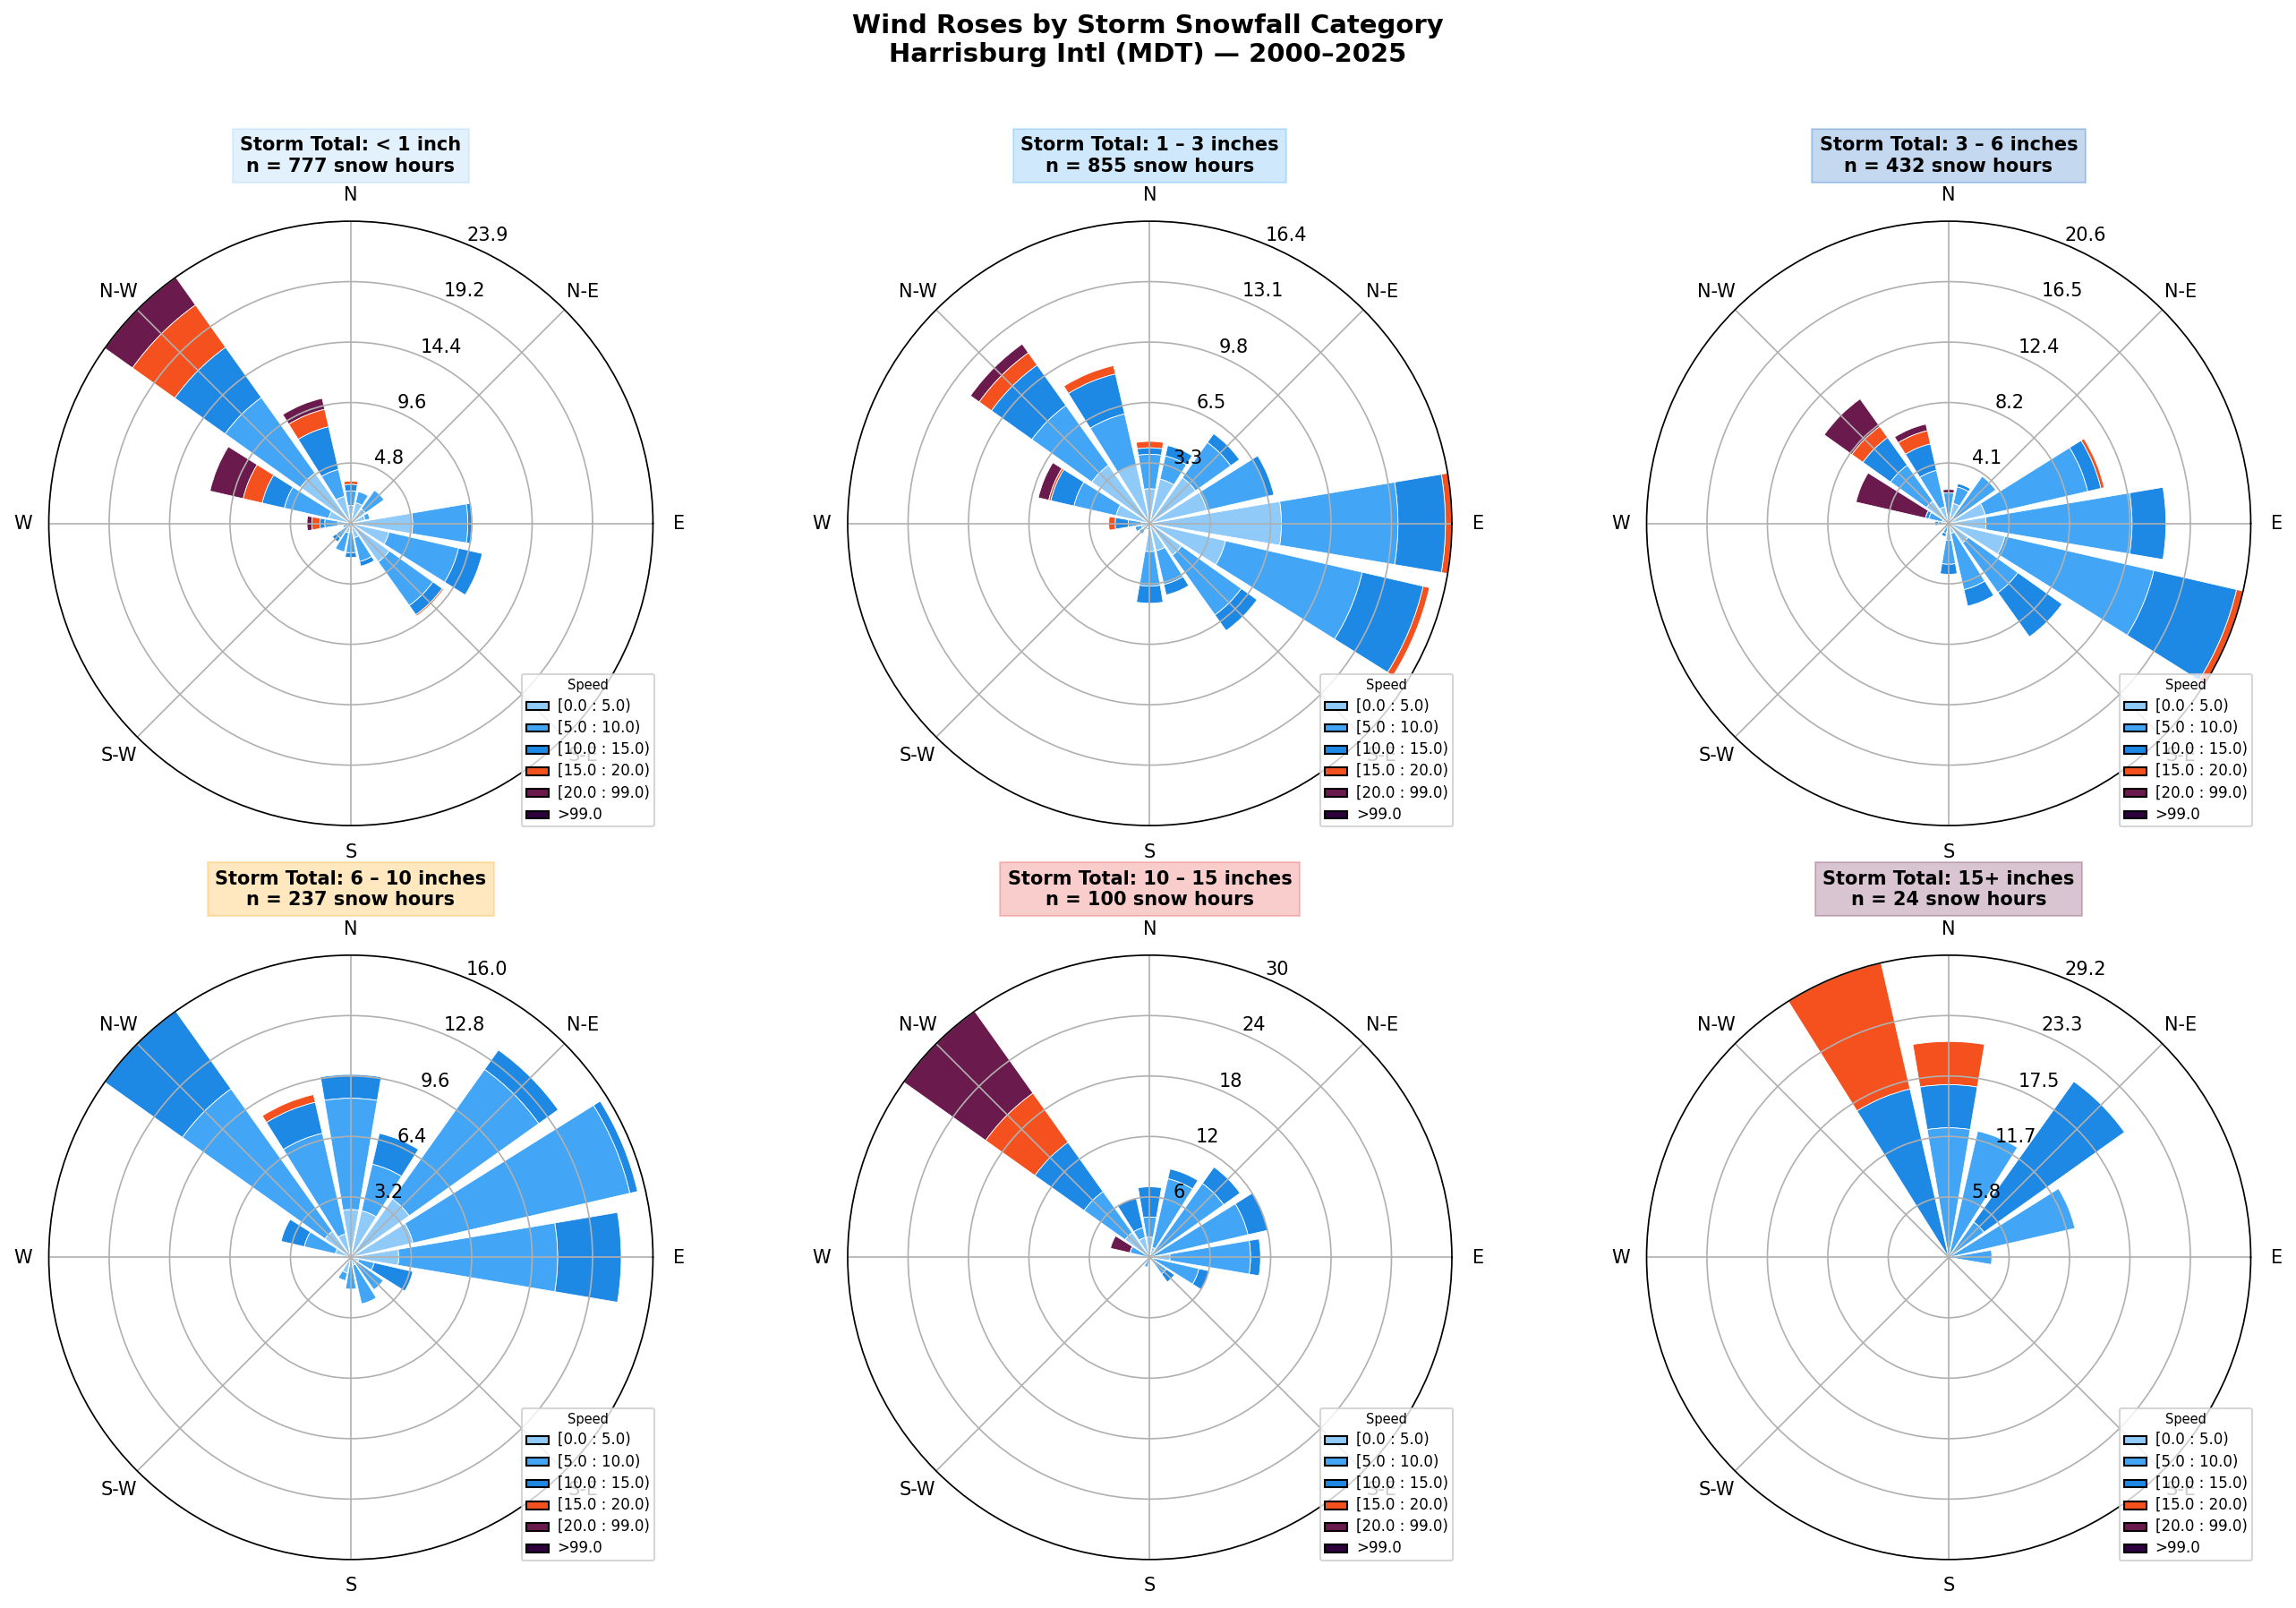
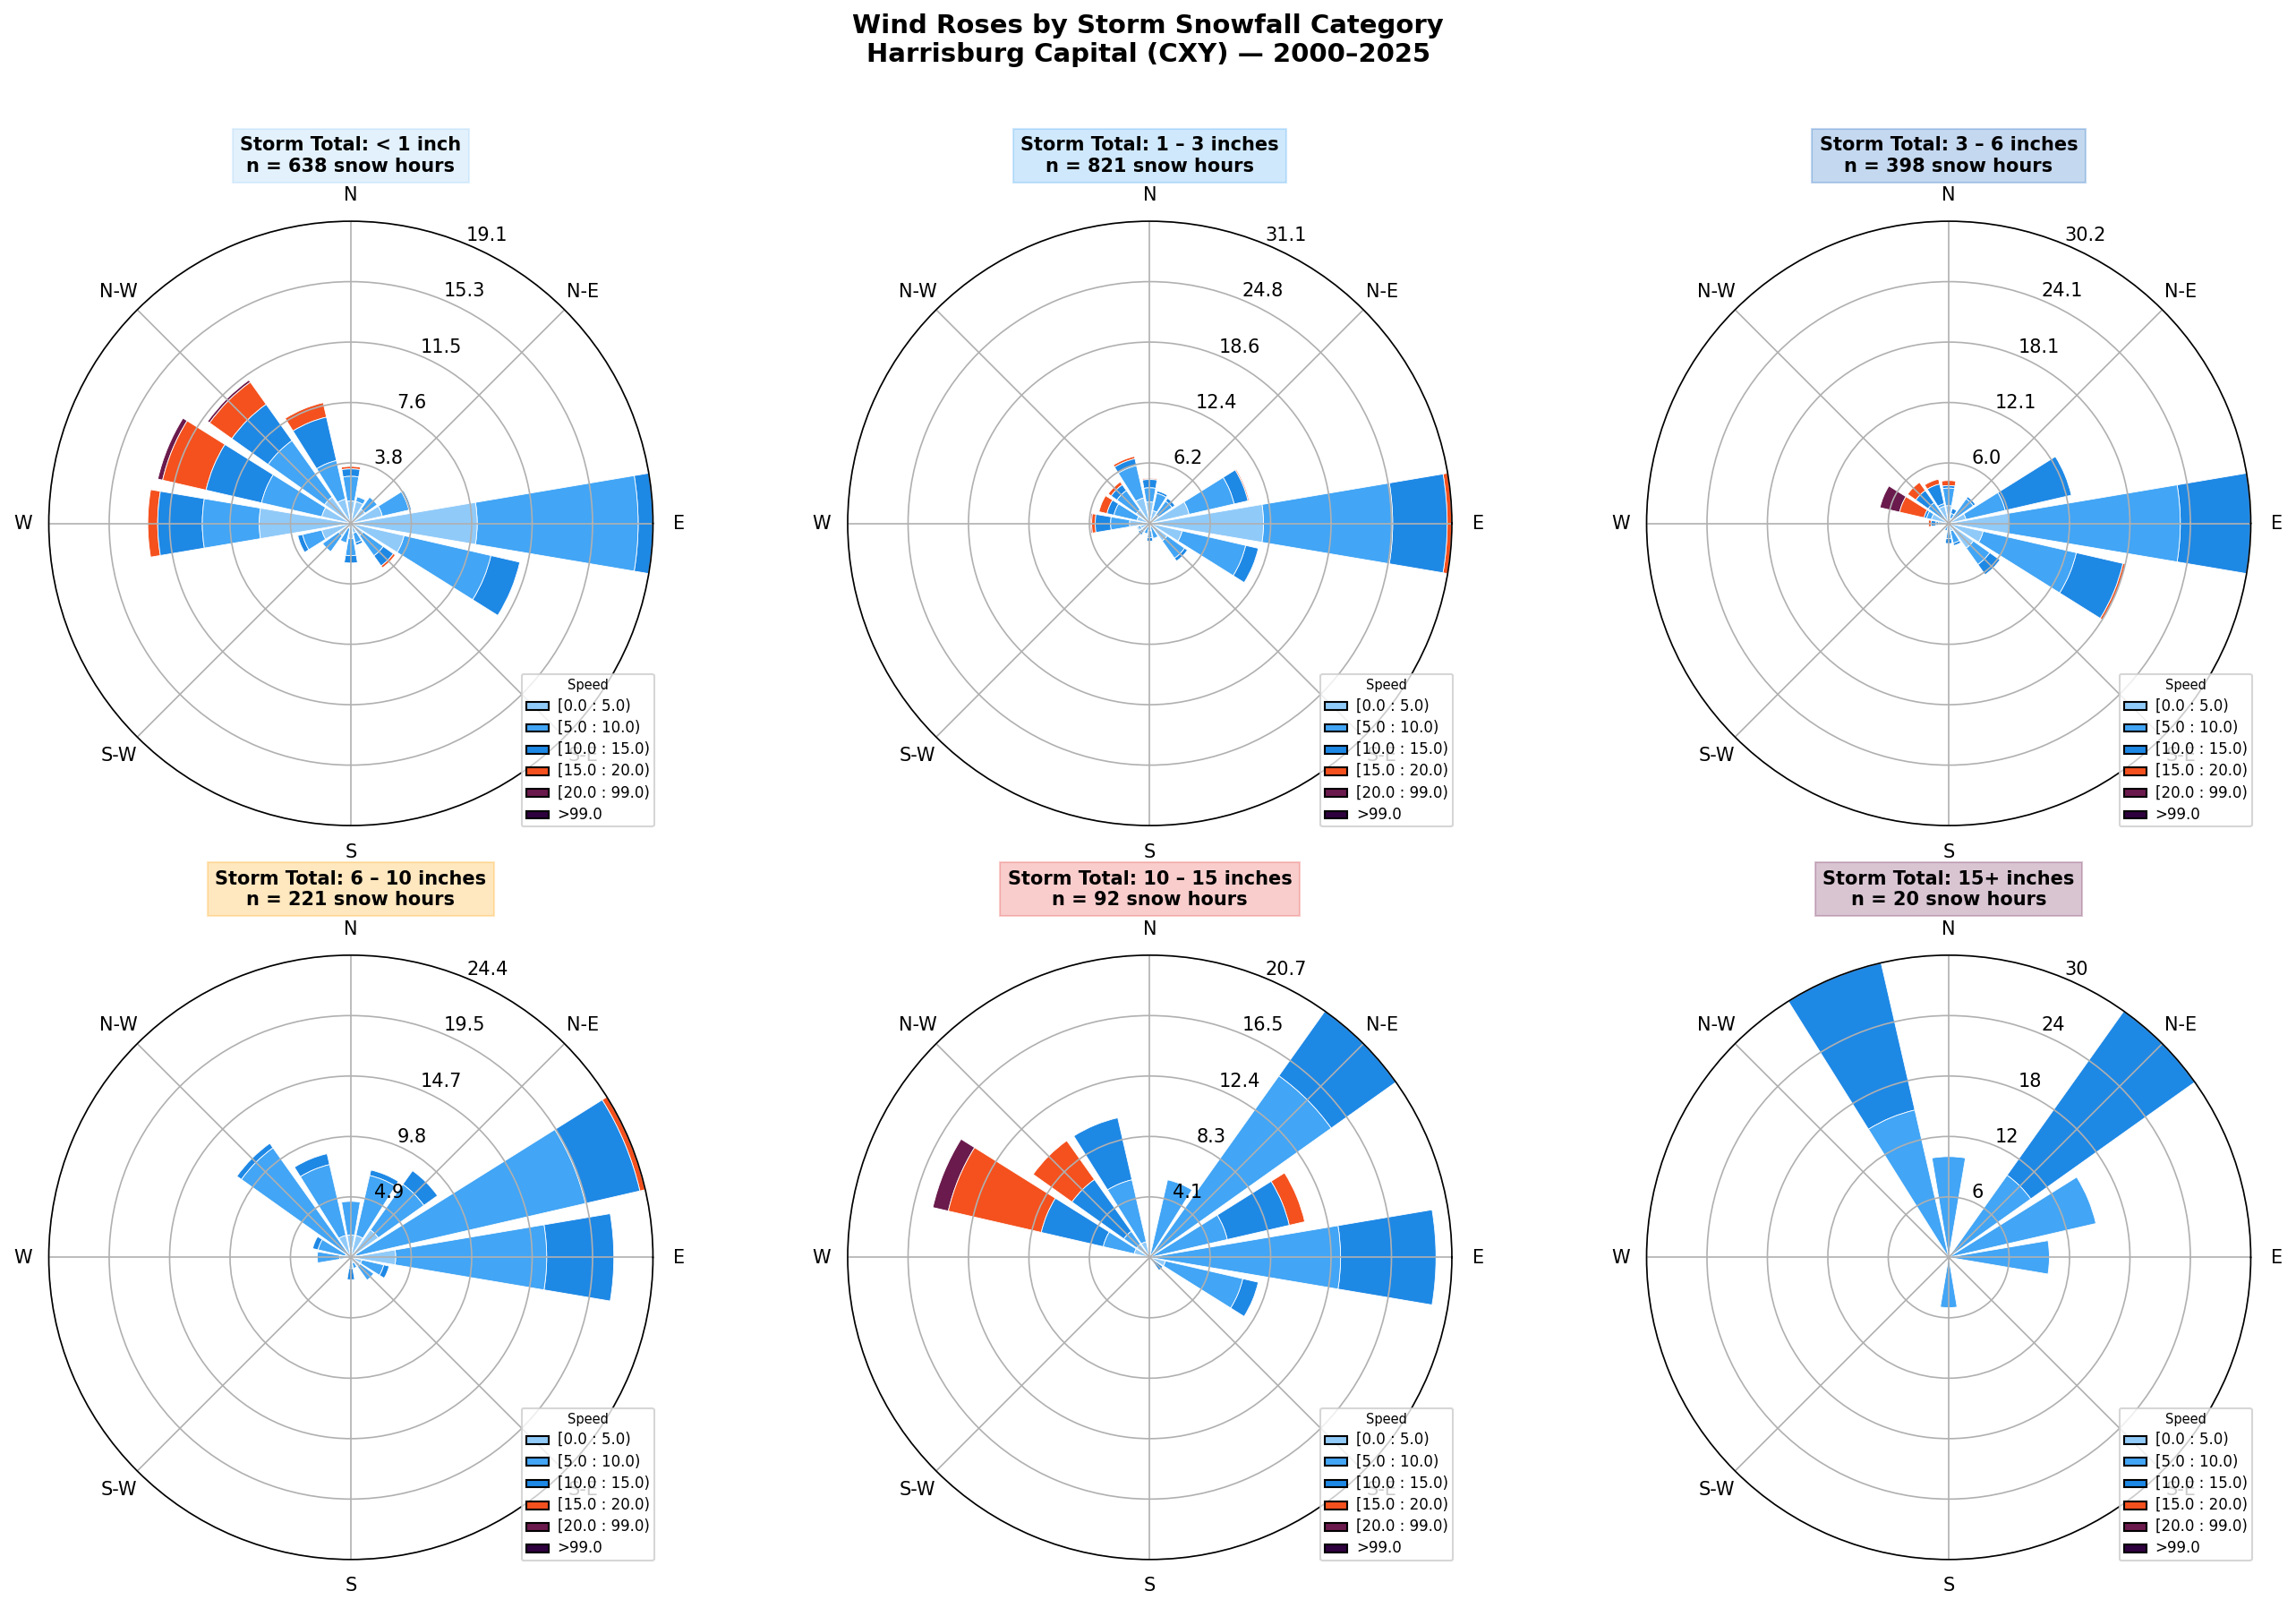
📐 Per-Station Wind Roses by Storm Category
Each station broken down by snowfall storm category. Larger storms (6-10", 10-15", 15+") tend to have stronger and more directionally consistent winds, typically from the NW–WNW quadrant. Note how light snow events (3-6") show much more scattered wind directions — consistent with clipper systems approaching from all angles.
KYORK / THV
KLNS / Lancaster
KMDT / Harrisburg
KCXY / Capital City
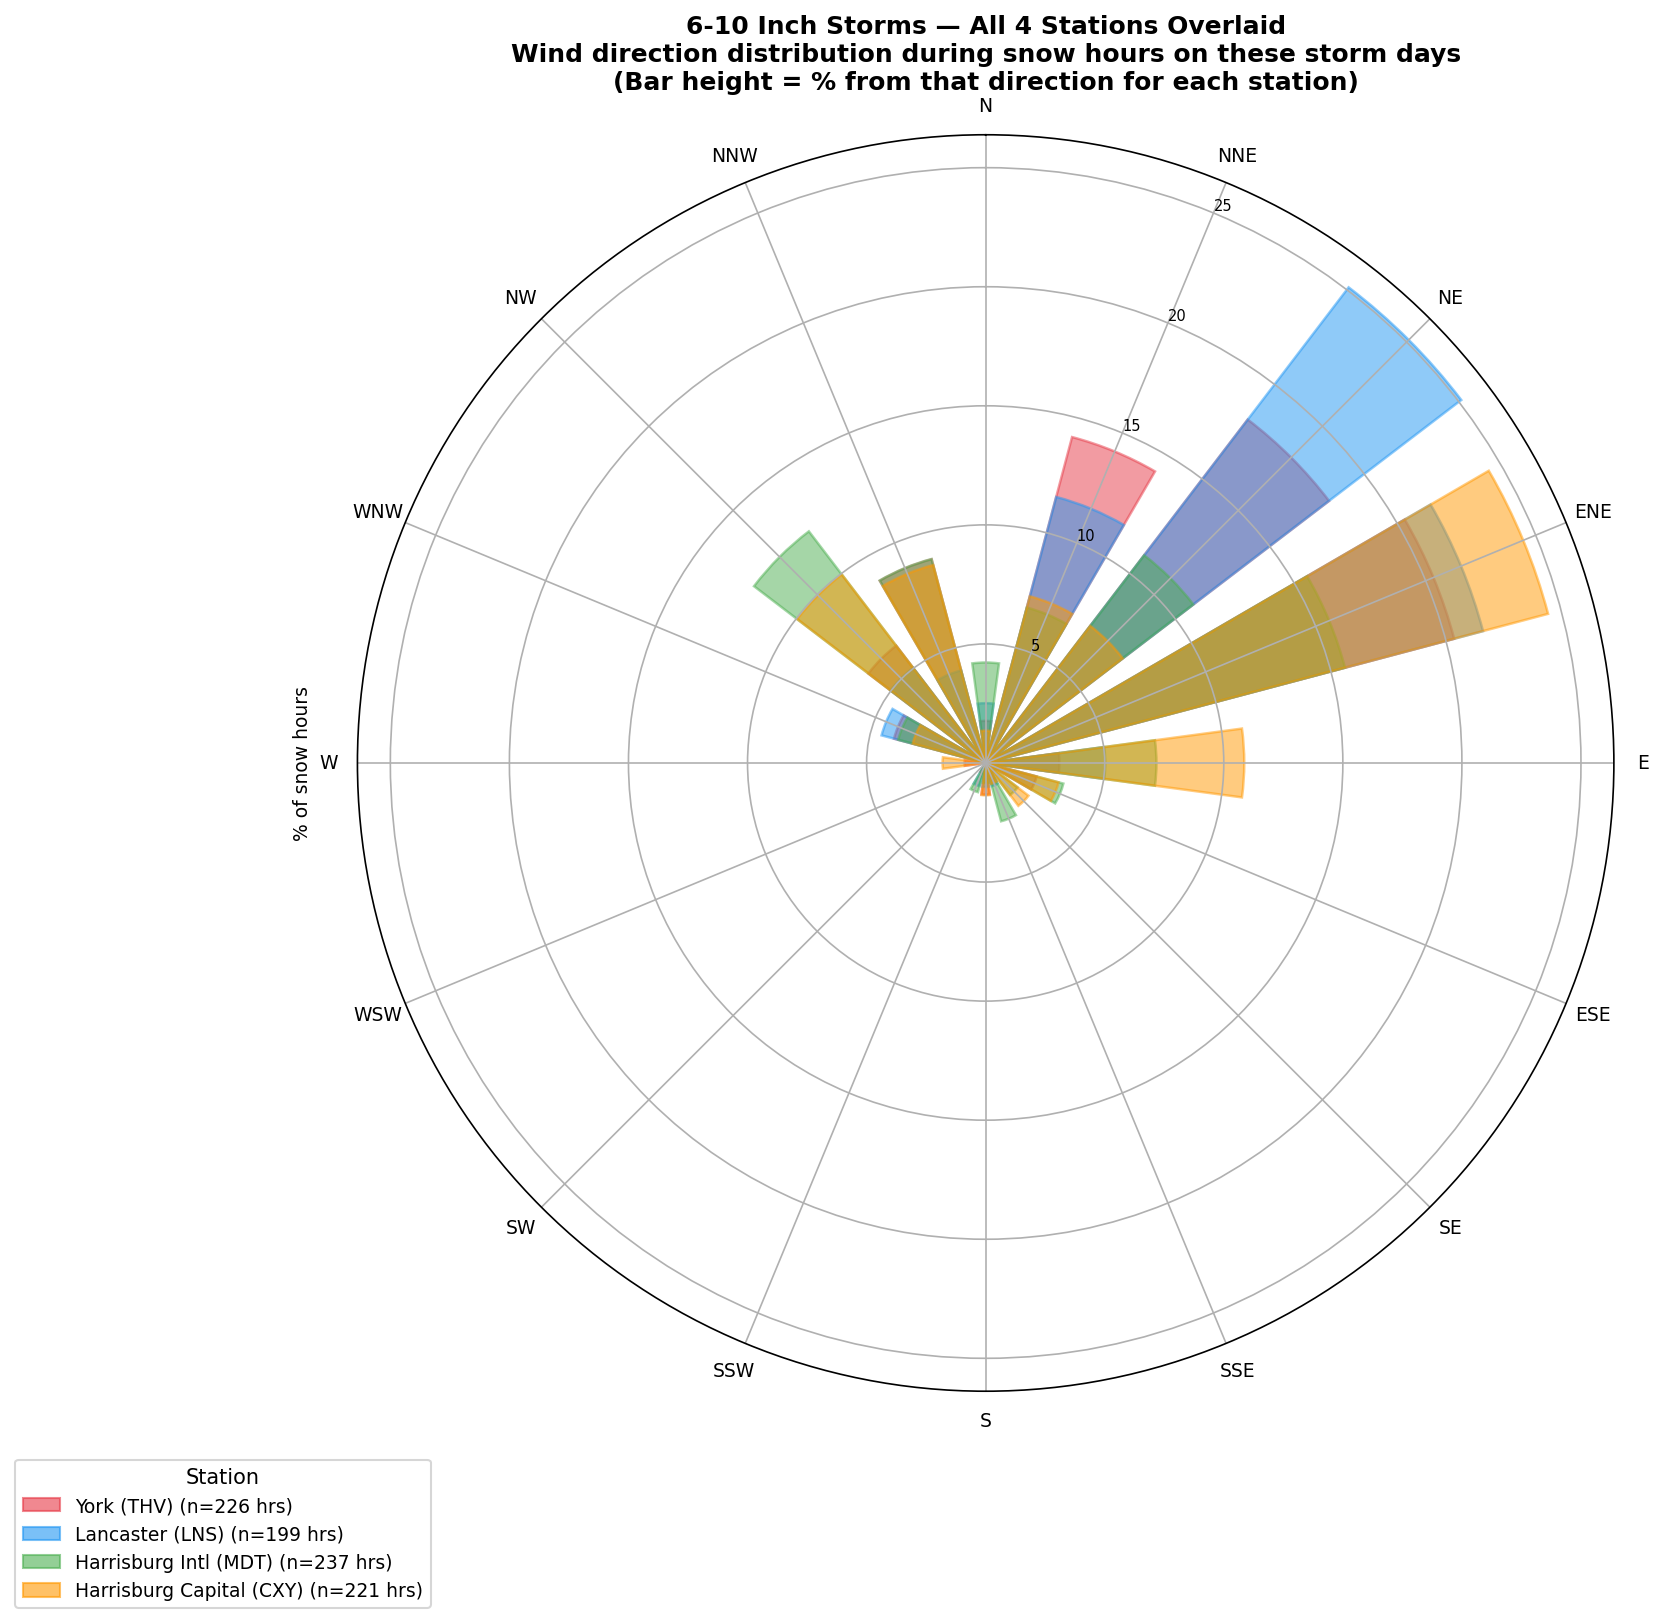
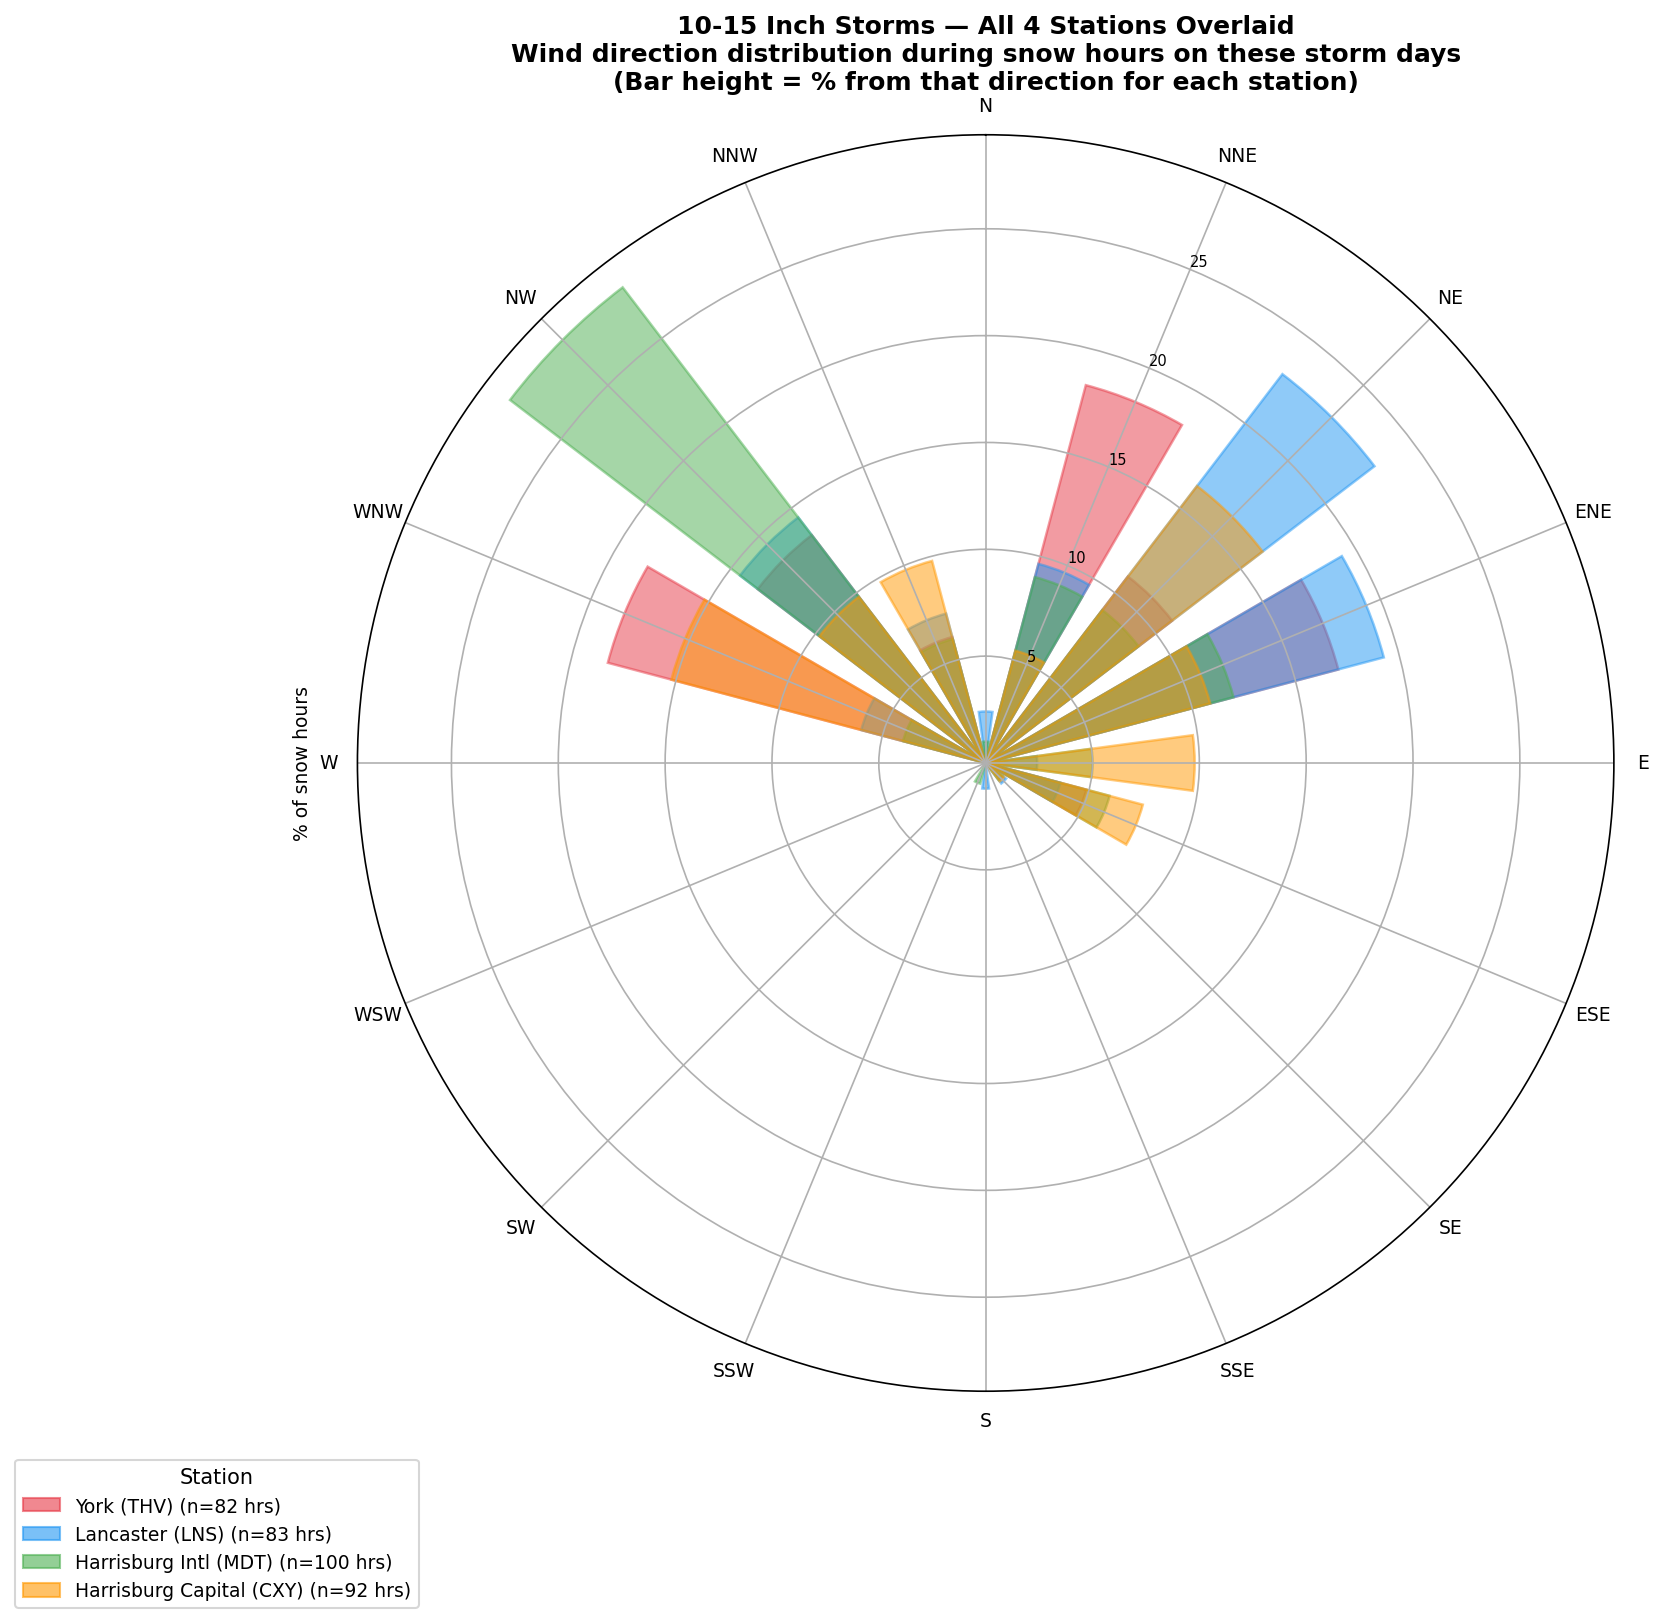
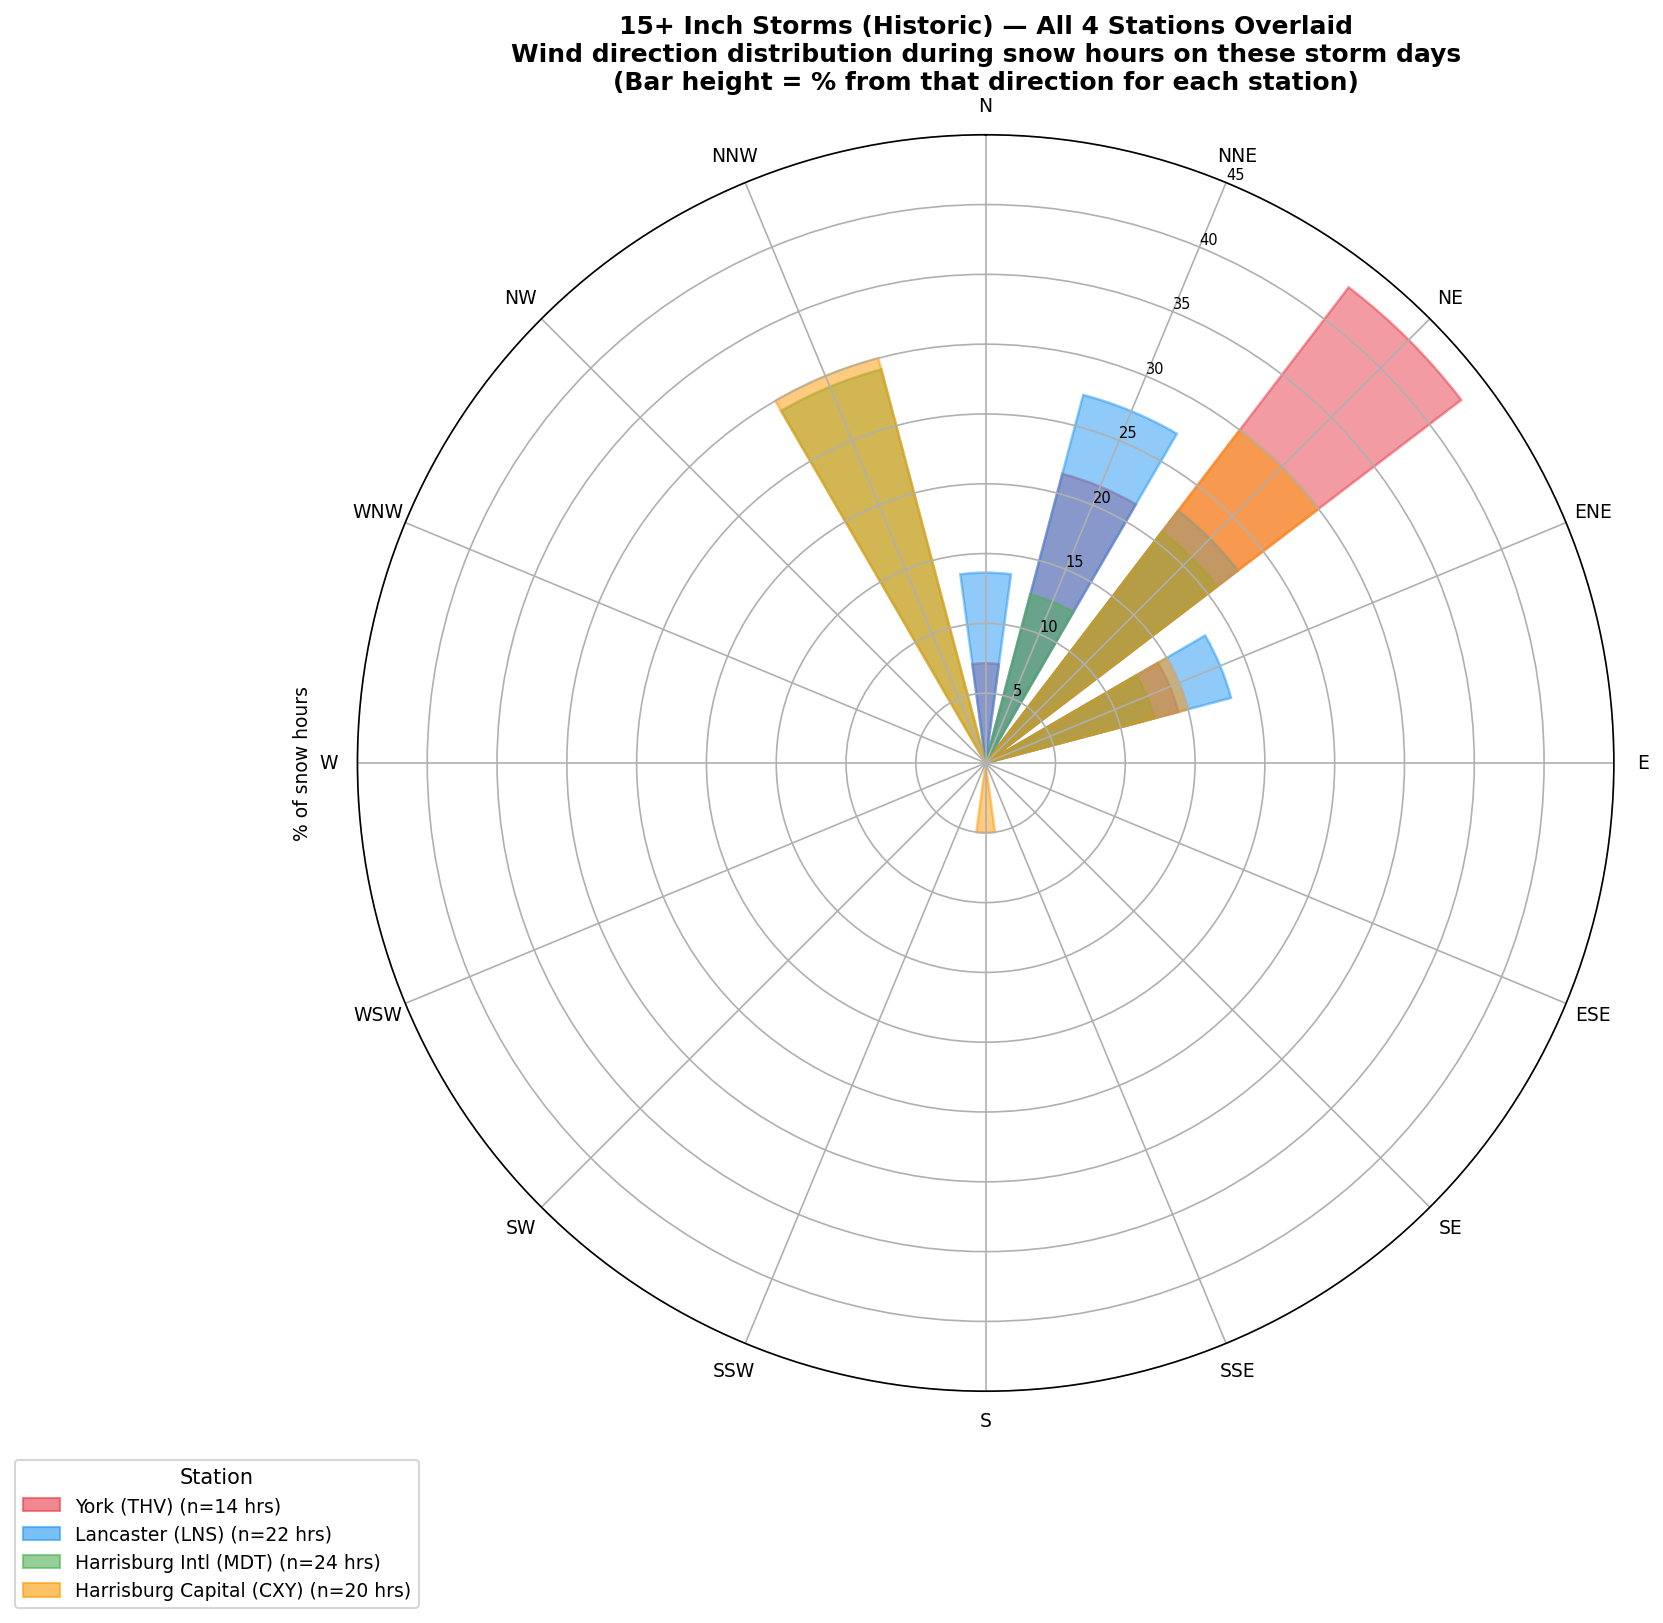
🌀 Major Storm Category Overlays
Overlaid wind roses for the three largest storm categories — showing how wind direction shifts and focuses with increasing snowfall. The 15+" category (single event: Blizzard Jonas) shows an intensely focused NW flow that drove the historic accumulations.
6–10" Storm Overlay
20 storm events
10–15" Storm Overlay
5 storm events
15+" Storm Overlay
1 storm event (Jonas)
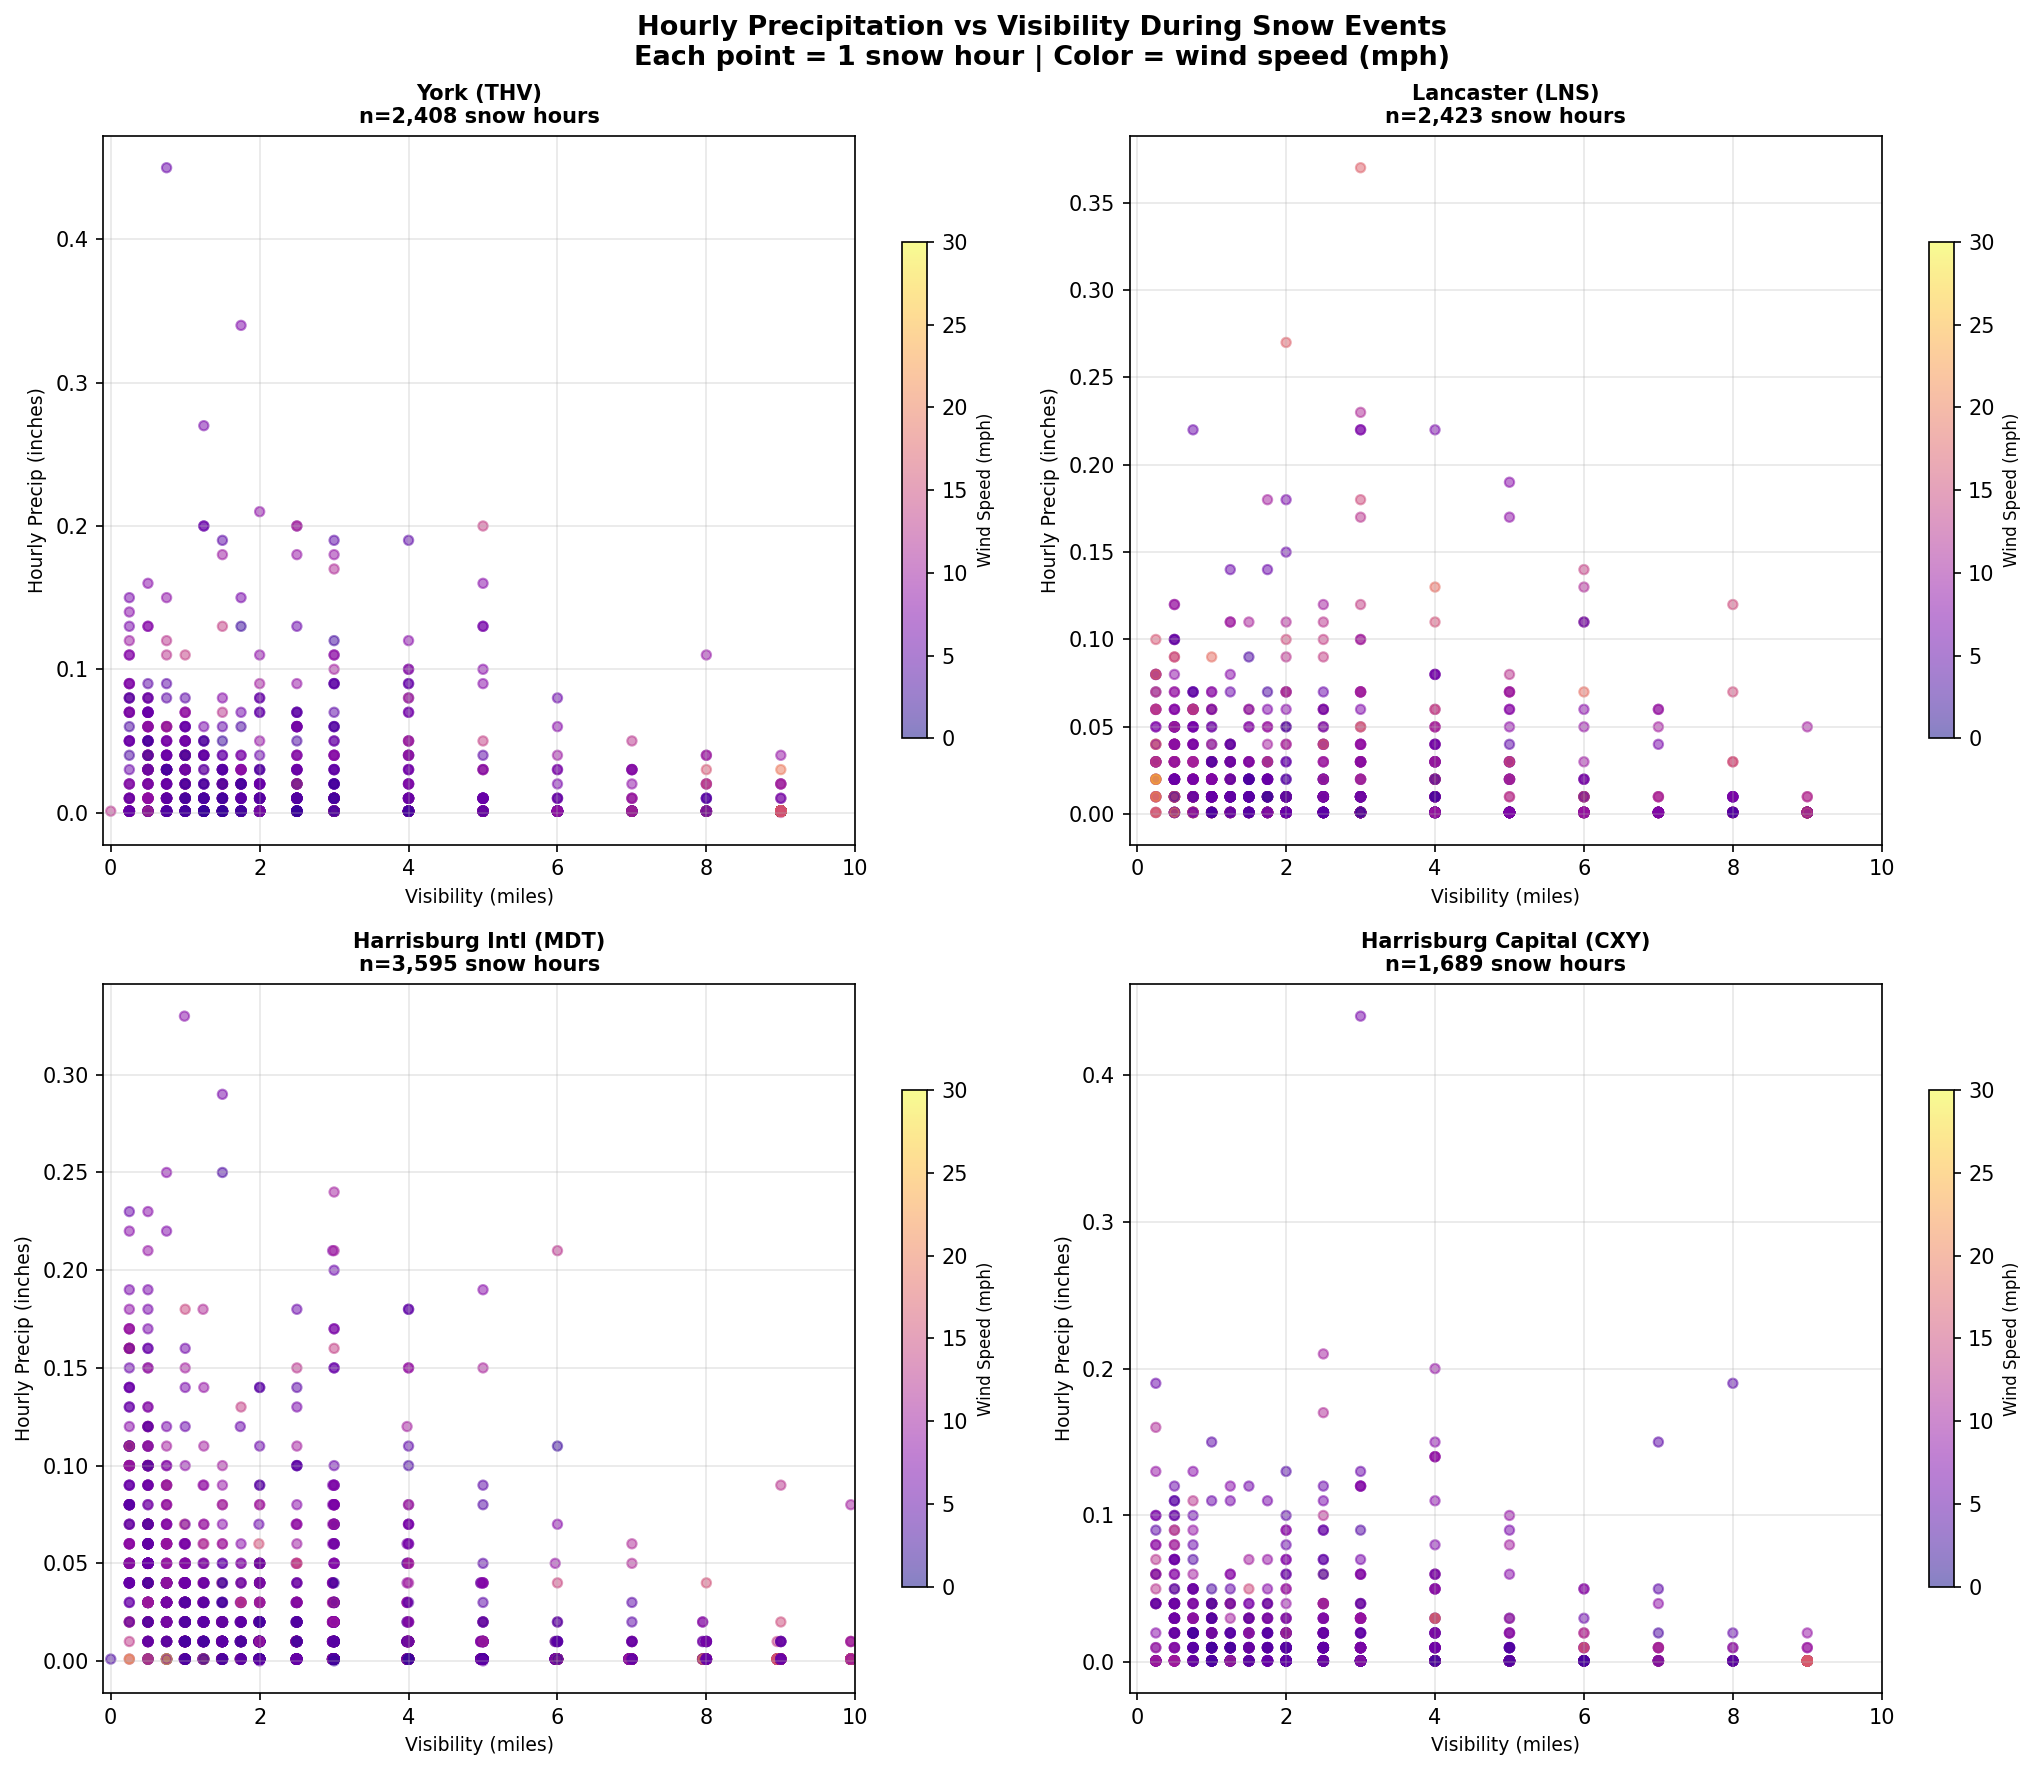
👁 Precip vs Visibility Scatter
Hourly precipitation rate vs. reported visibility during snow. Lower visibility strongly correlates with higher precip rates, validating snow intensity estimation from visibility.
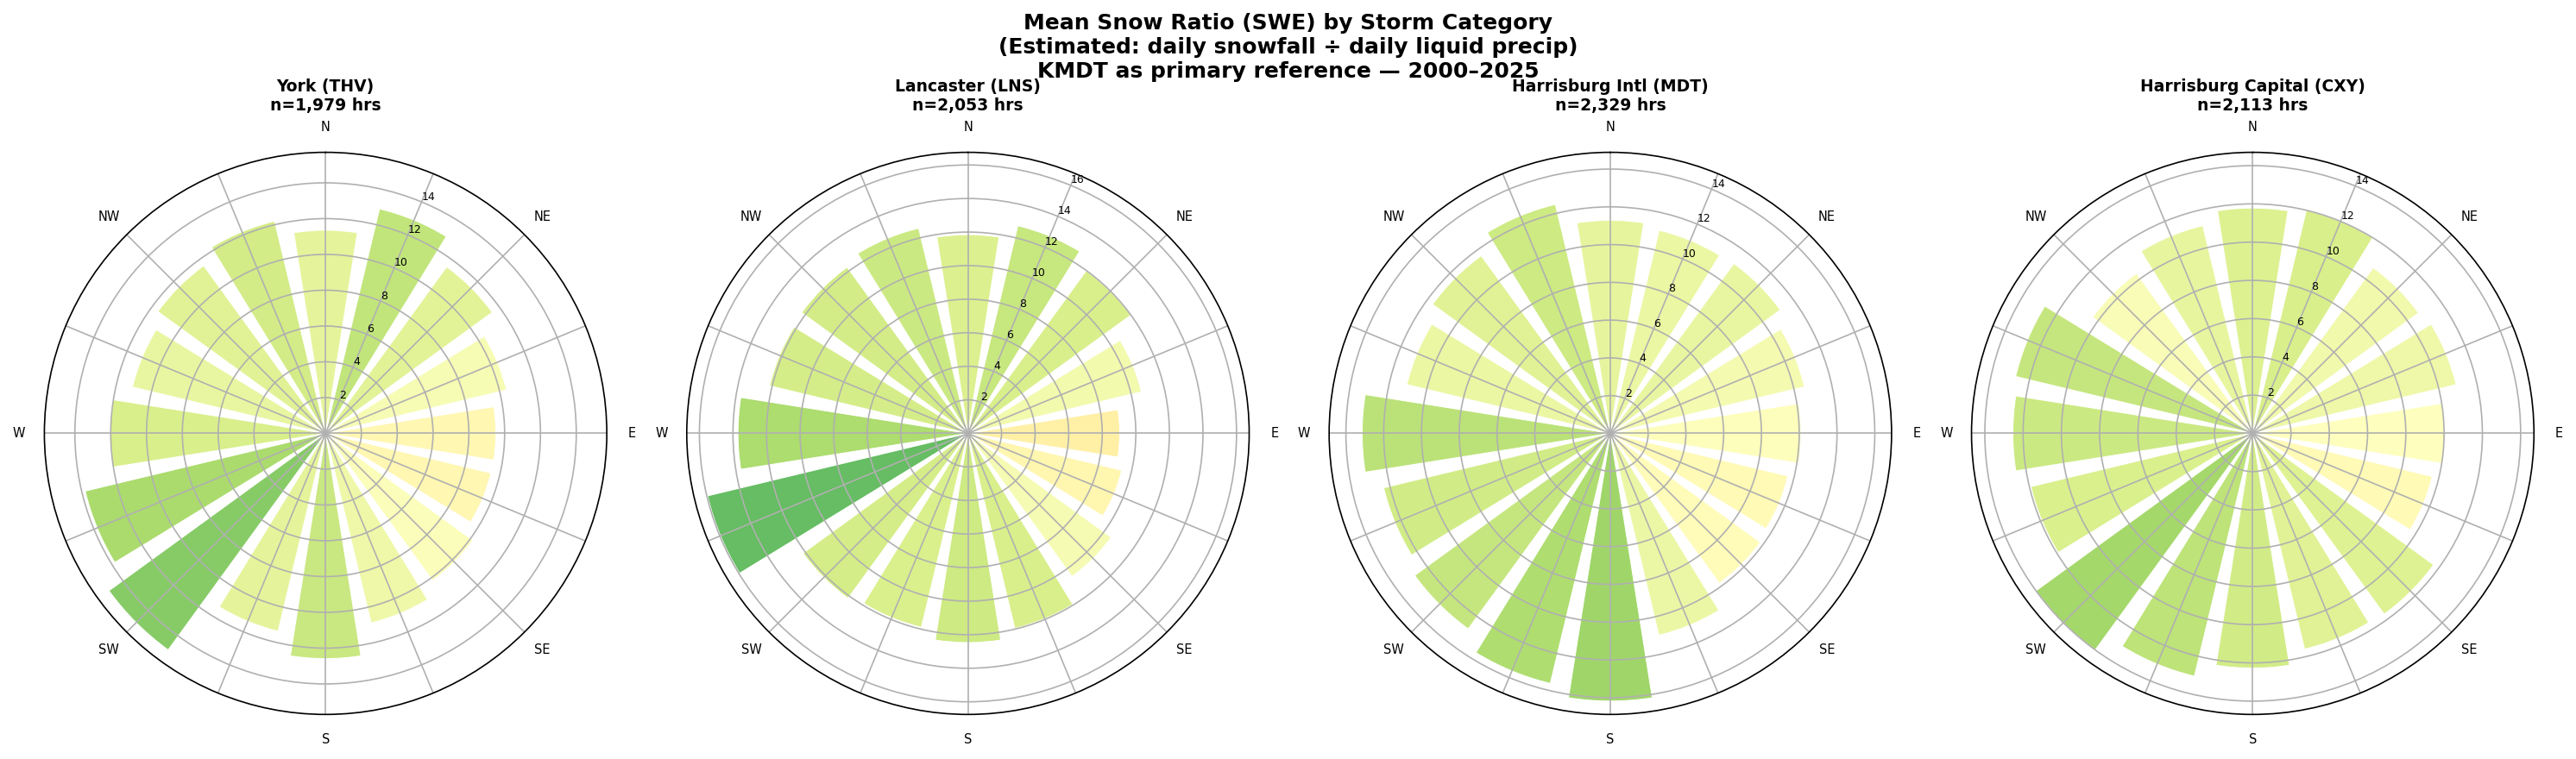
🧭 Snow Ratio by Wind Direction
Polar plot of average snow-to-liquid ratio by wind direction. NW winds produce the highest ratios (lightest, fluffiest snow). SE winds during snow events tend toward heavier, wetter snow with lower ratios — typical of Nor'easters.
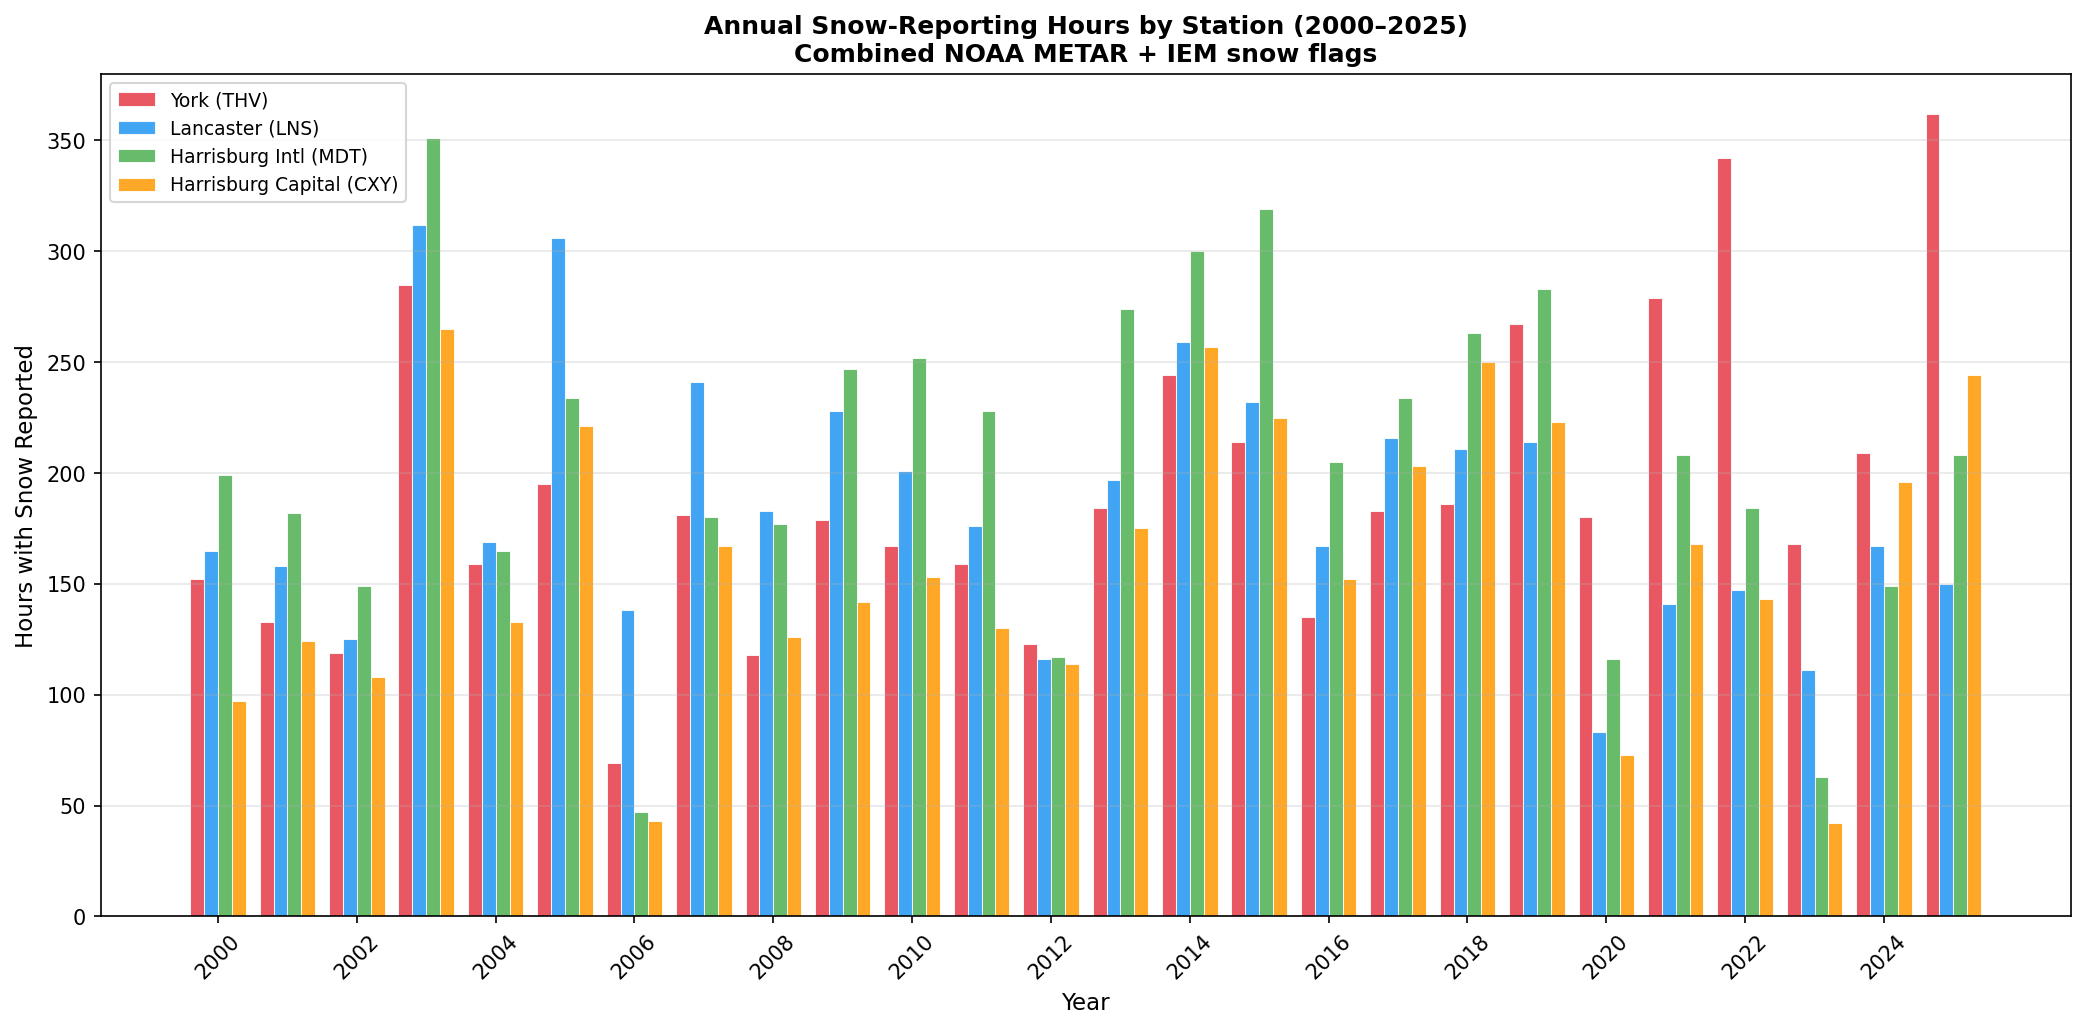
📅 Annual Snow Hours by Station
Year-over-year variation in total snow hours per station. 2009-10 stands out dramatically with the Snowpocalypse + Snowmageddon double-event dominating that winter.
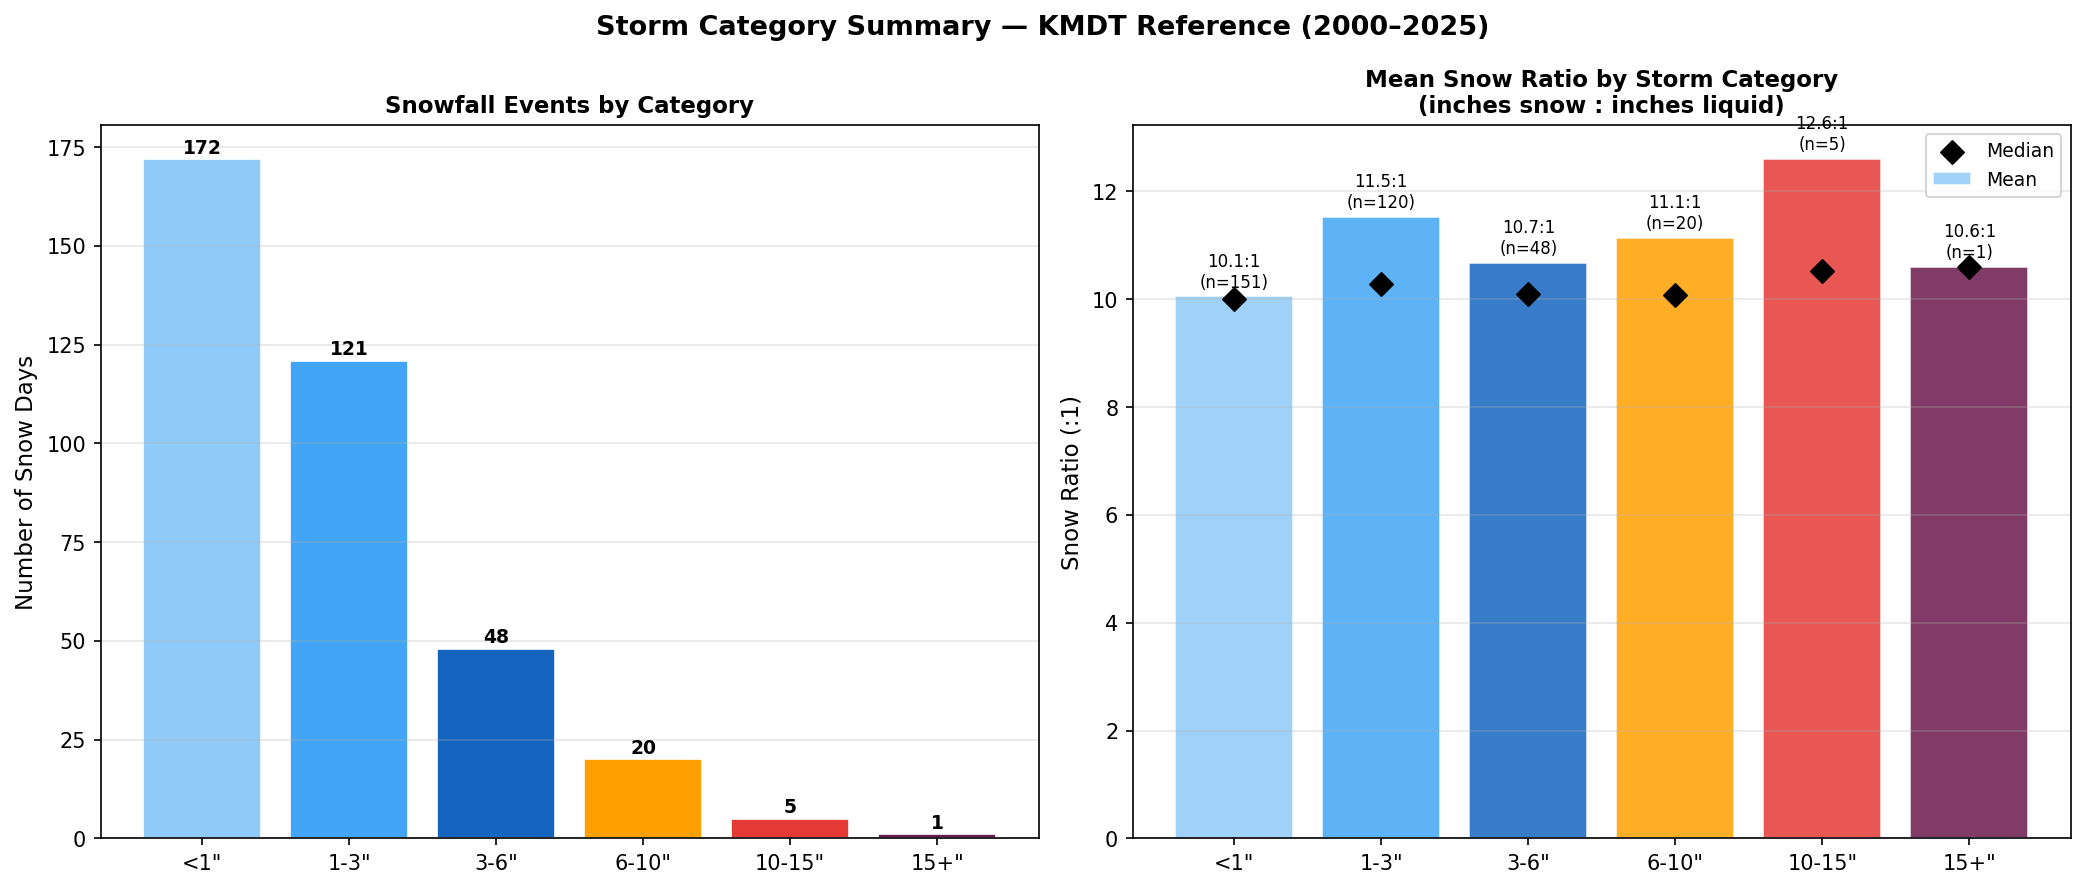
📊 Storm Summary by Category
Summary statistics for each storm size category: average duration, snow hours, wind speeds, and ratio distributions. Larger storms consistently show higher average wind speeds and tighter directional spreads.